Nutanix Tech Overview Lab
Overview
This lab will introduce the Prism Element UI, and familiarize you with its layout and navigation.
Prism Element
The Prism service provides the web UI for managing Nutanix clusters and runs on every Controller VM (CVM). This local Prism service, referred to Prism Element, can be accessed via the IP of any individual CVM, or via the virtual IP for the cluster, which will redirect to the current Prism leader.
From the Firefox web browser (preferred), log into the Nutanix Prism GUI using the Cluster IP.
Open https://<NUTANIX-CLUSTER-IP>:9440 in a new browser tab.
Log in using the following credentials:
Username - admin
Password - HPOC Password
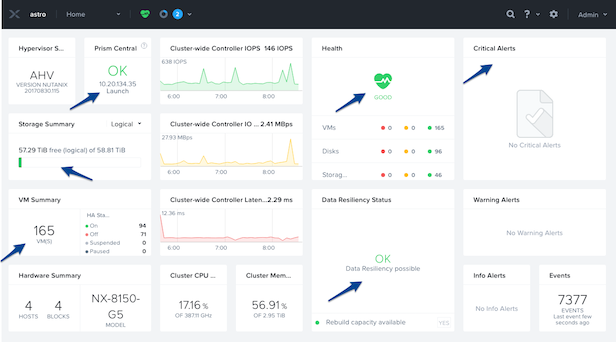
After you log in to Prism Element, familiarize yourself with the Prism UI. Explore the information on the Home screen, as well as the other screens.
Review the Home screen, and identify the following items:
Hypervisor
Version
Hardware Model
Health
VM Summary
Warning Alerts
Data Resiliency Status
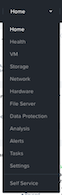
Review the UI navigation options under the View Options pull-down menu. The label of this menu changes based on the dashboard that is currently displayed. For example, from the Home dashboard it will be labeled Home, from the Health dashboard it will be labeled Health, etc.
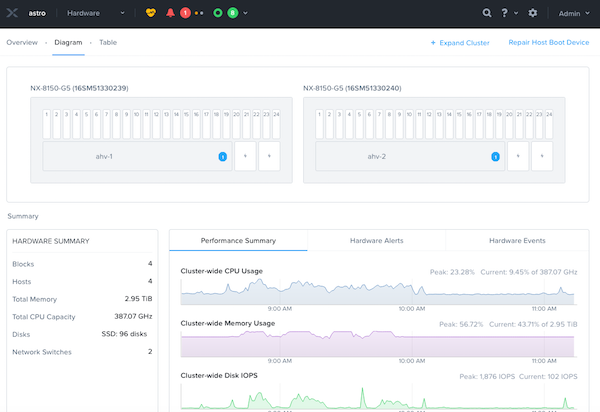
Examine the cluster hardware under Prism > Hardware, click Hardware, then click Diagram.
Review the hardware summary information:
Blocks
Hosts
Memory
CPU
Disks
Review the other sections, and do a quick walk through:
VM
Health
Network
Data Protection
Storage
Alerts
Etc.
Review other sections of the Prism UI
Health
Alarms
Tasks
Search
Help
Configuration
User

Prism Element UI Review
Where would you locate the version of AOS you are running?
You can do this by clicking on the User drop down , and clicking About Nutanix.
How would you get to the following screen to view a summary of the number of hosts (or nodes) and the resource capacity and current utilization?
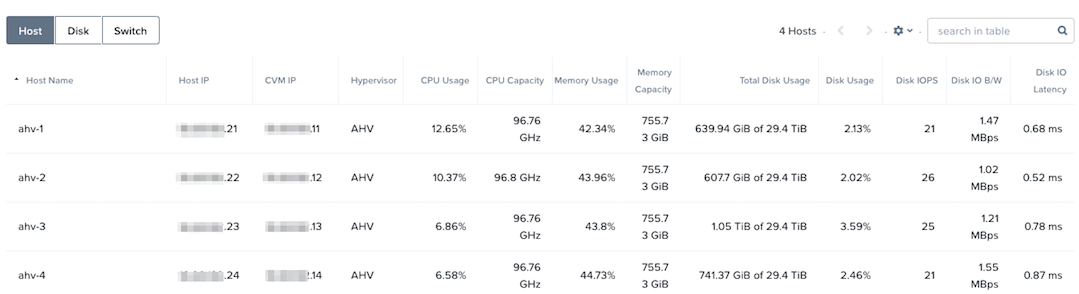
In Prism > Hardware, click Hardware, then click Table.
How would you get the following screen to see the health of your cluster?
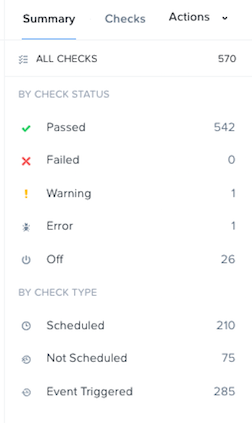
In Prism > Health, click Health, then click Summary in the right pane.
What page would show you the latest activity in the system? On this page, you can monitor the progress of any task and keep track of what has been done in the past using time stamps. Can you figure out two different ways to get there?
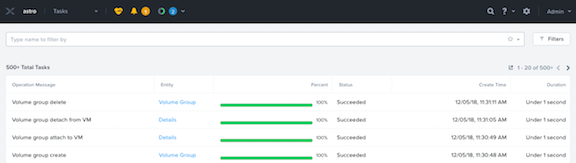
From the View Options menu, select Tasks, or click the circle icon in the toolbar, to the right of the bell icon .
Note
In ESXi:
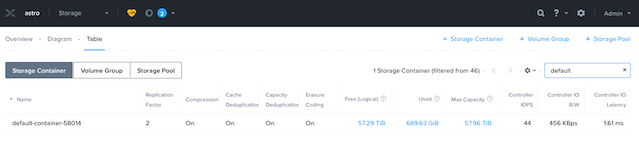
The containers created in Prism appear as datastores in vCenter.
Example view of storage containers from Prism:
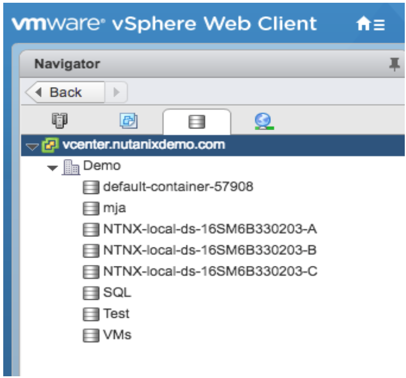
Example view of storage containers (datastores) from vCenter:
Takeaways
Prism is thoughtfully laid out UI
Critical information is displayed front and center