Right-sizing VMs with Prism Pro
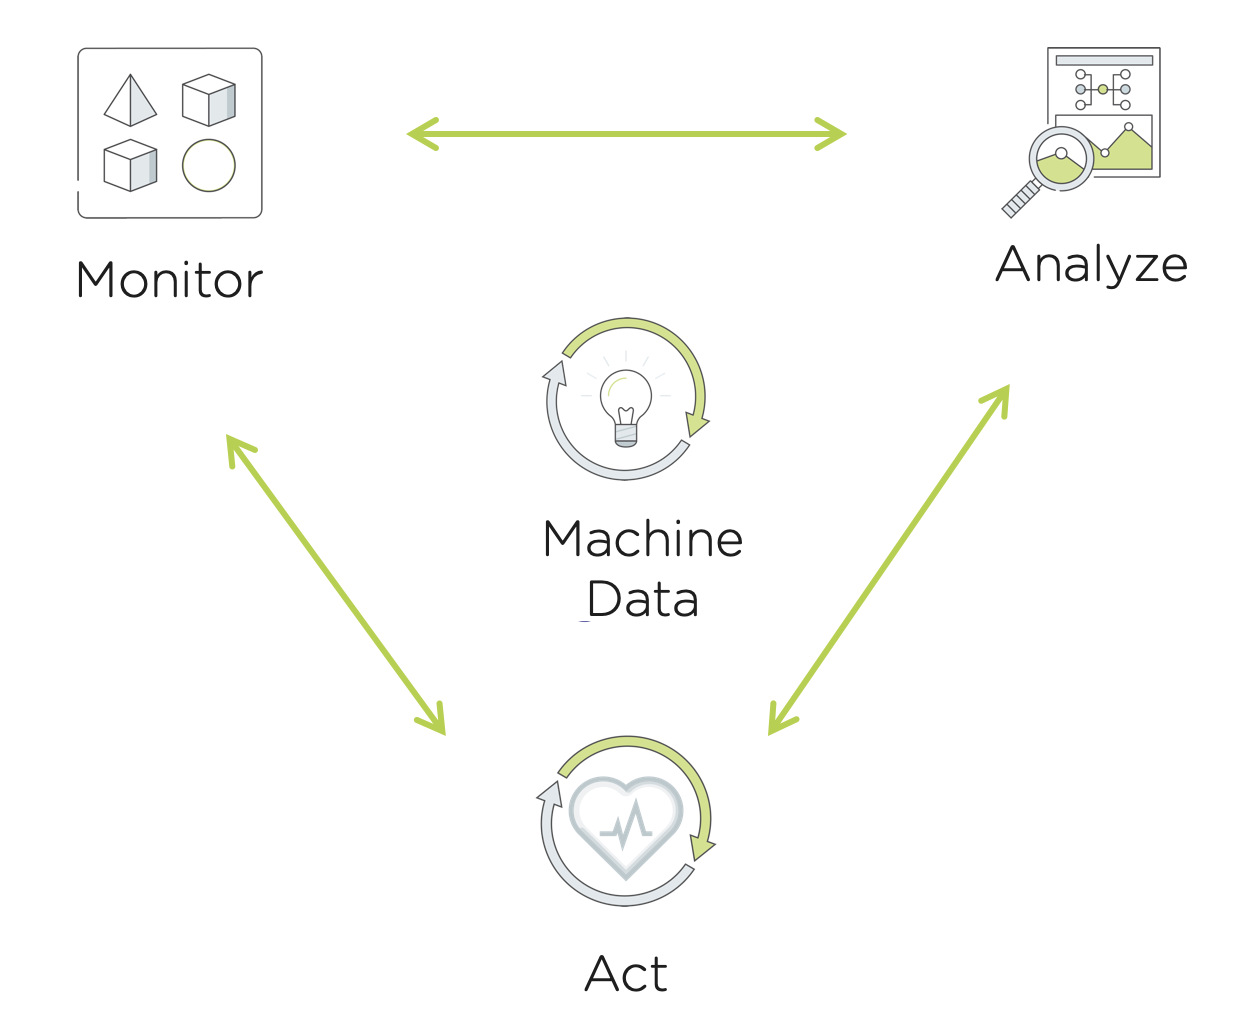
Prism Pro brings smart automation to our customer’s daily IT operations. The typical operations workflow is a continuous cycle of monitoring, analyzing and taking action where necessary. Prism Pro mirrors traditional IT Admin’s workflows to improve operations efficiency. With Prism Pro, IT Admins are able to connect insights from machine data to automate this typical flow using the power of the machine learning engine X-FIT and the X-Play automation engine.
In this lab you will learn how Prism Pro can help IT Admins monitor, analyze and automatically act when a VM’s memory resource is constrained.
Lab Setup
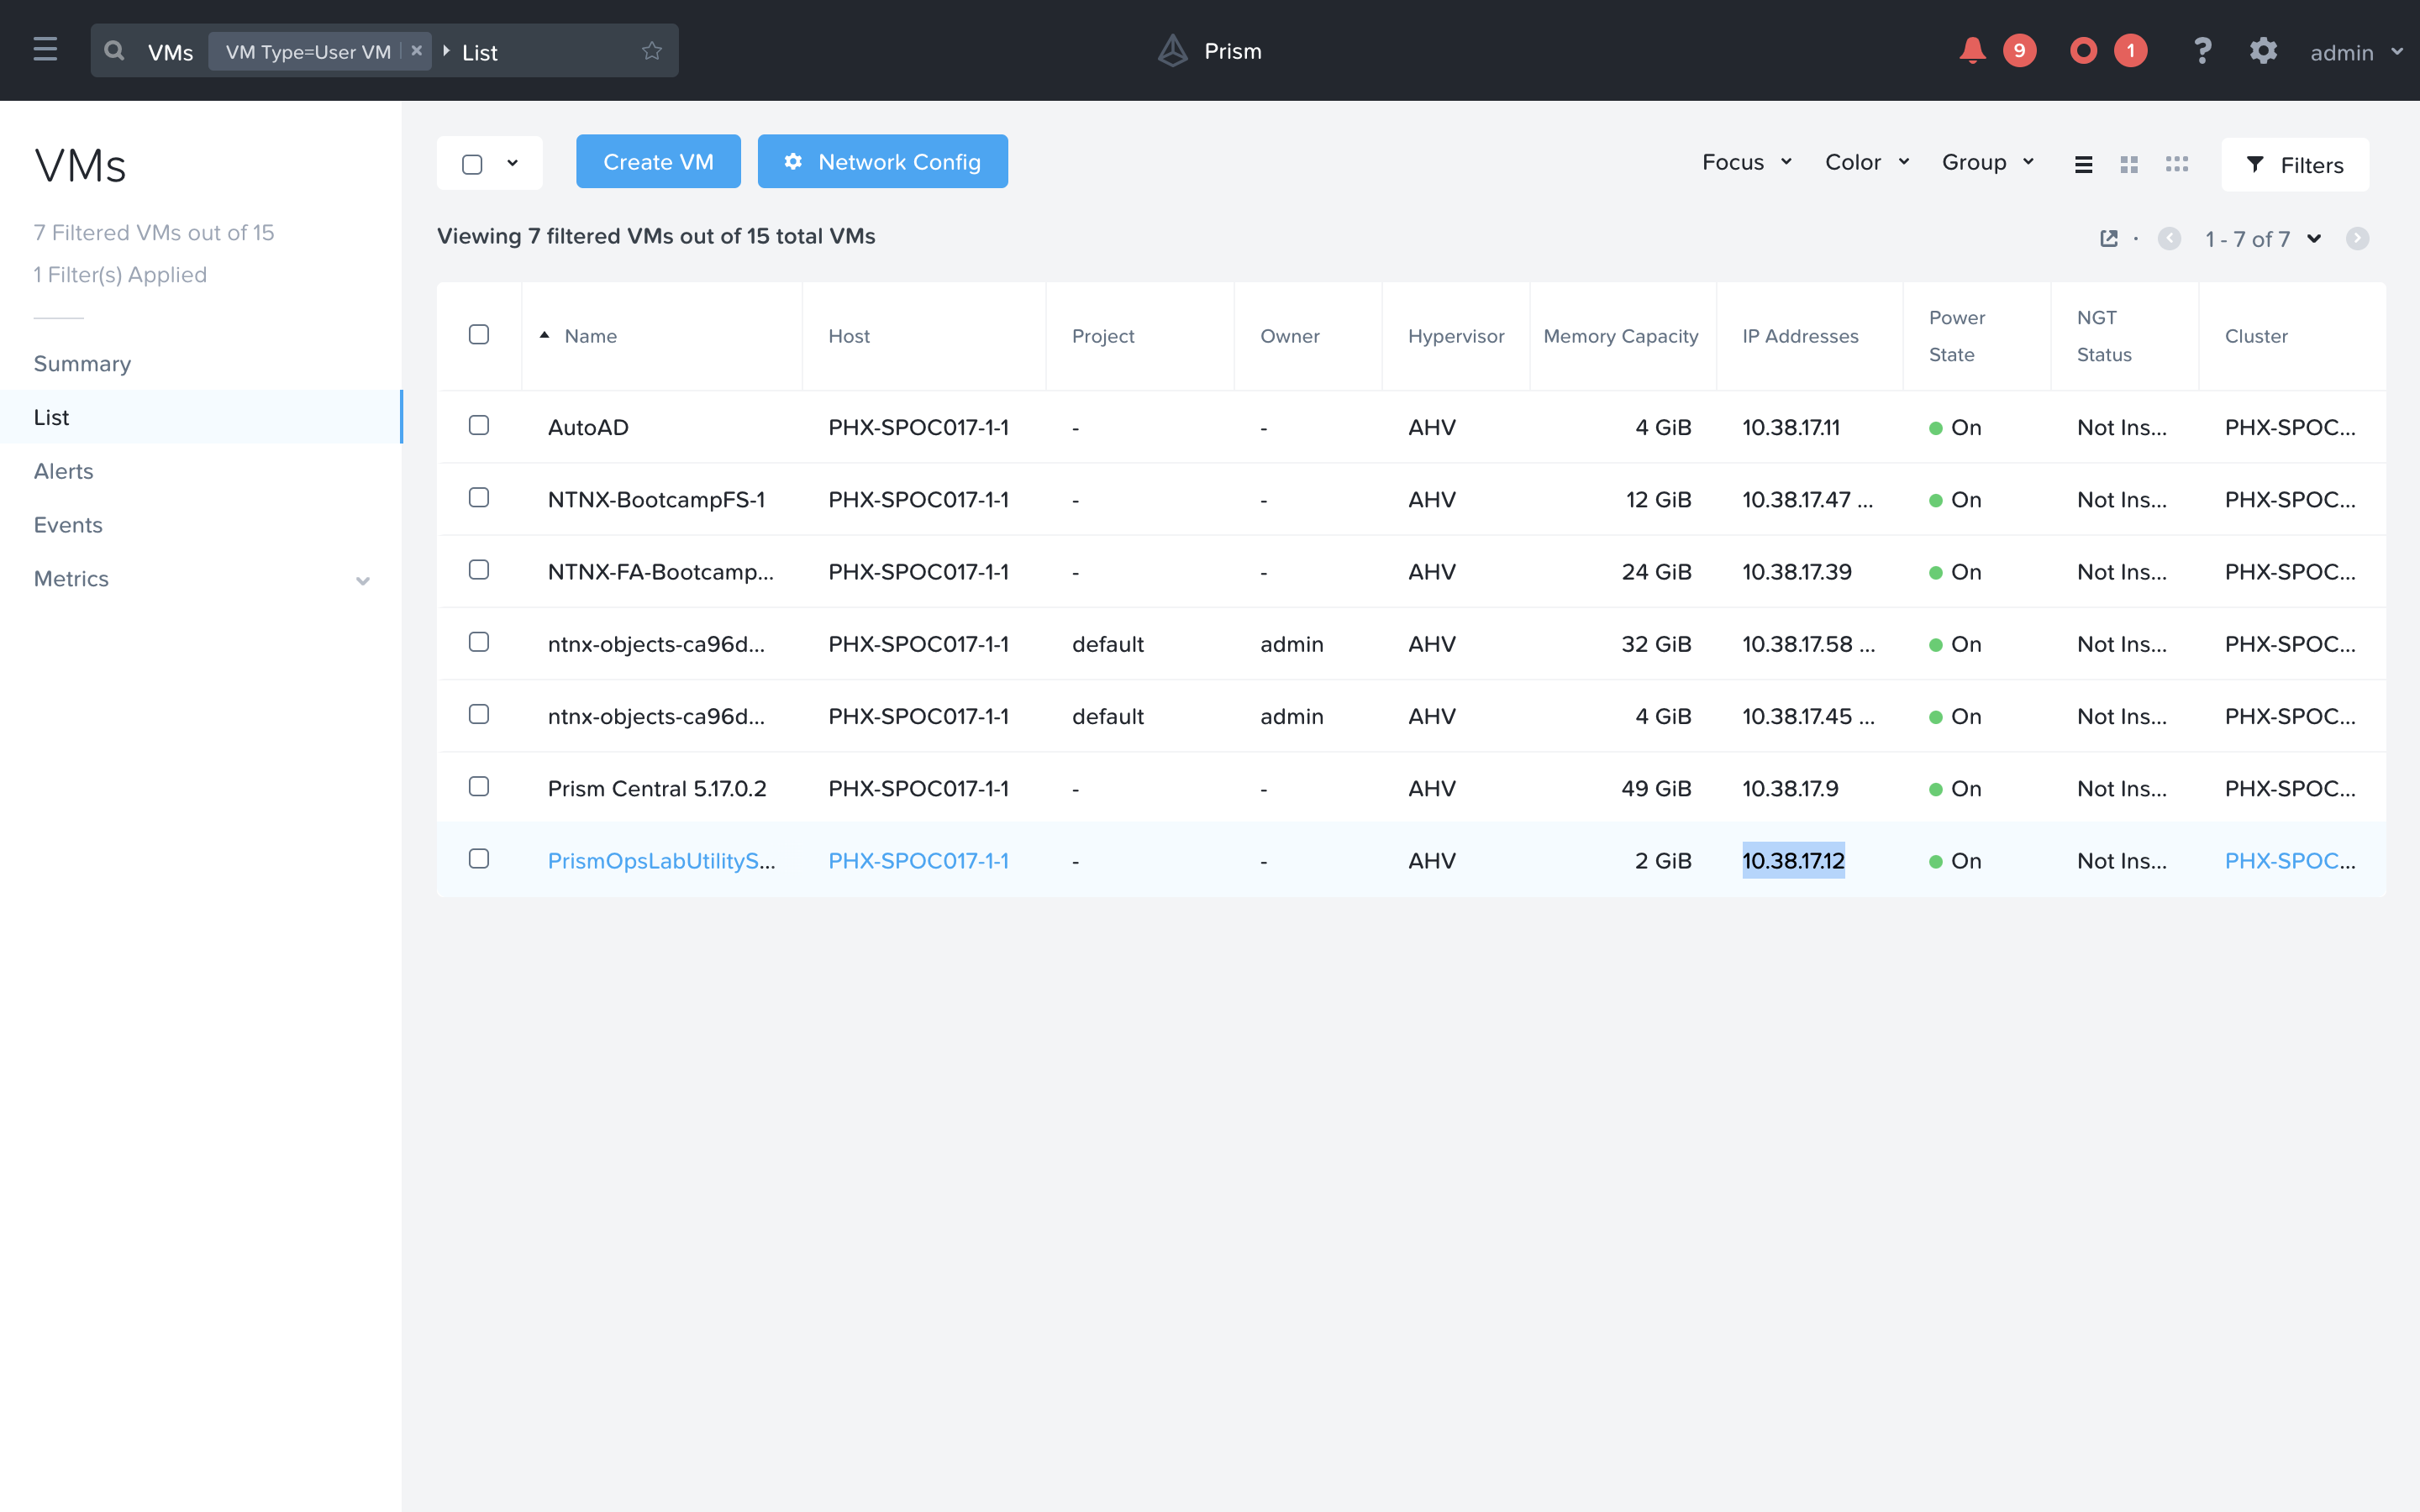
Open your Prism Central and navigate to the VMs page. Note down the IP Address of the PrismOpsLabUtilityServer. You will need to access this IP Address throughout this lab.
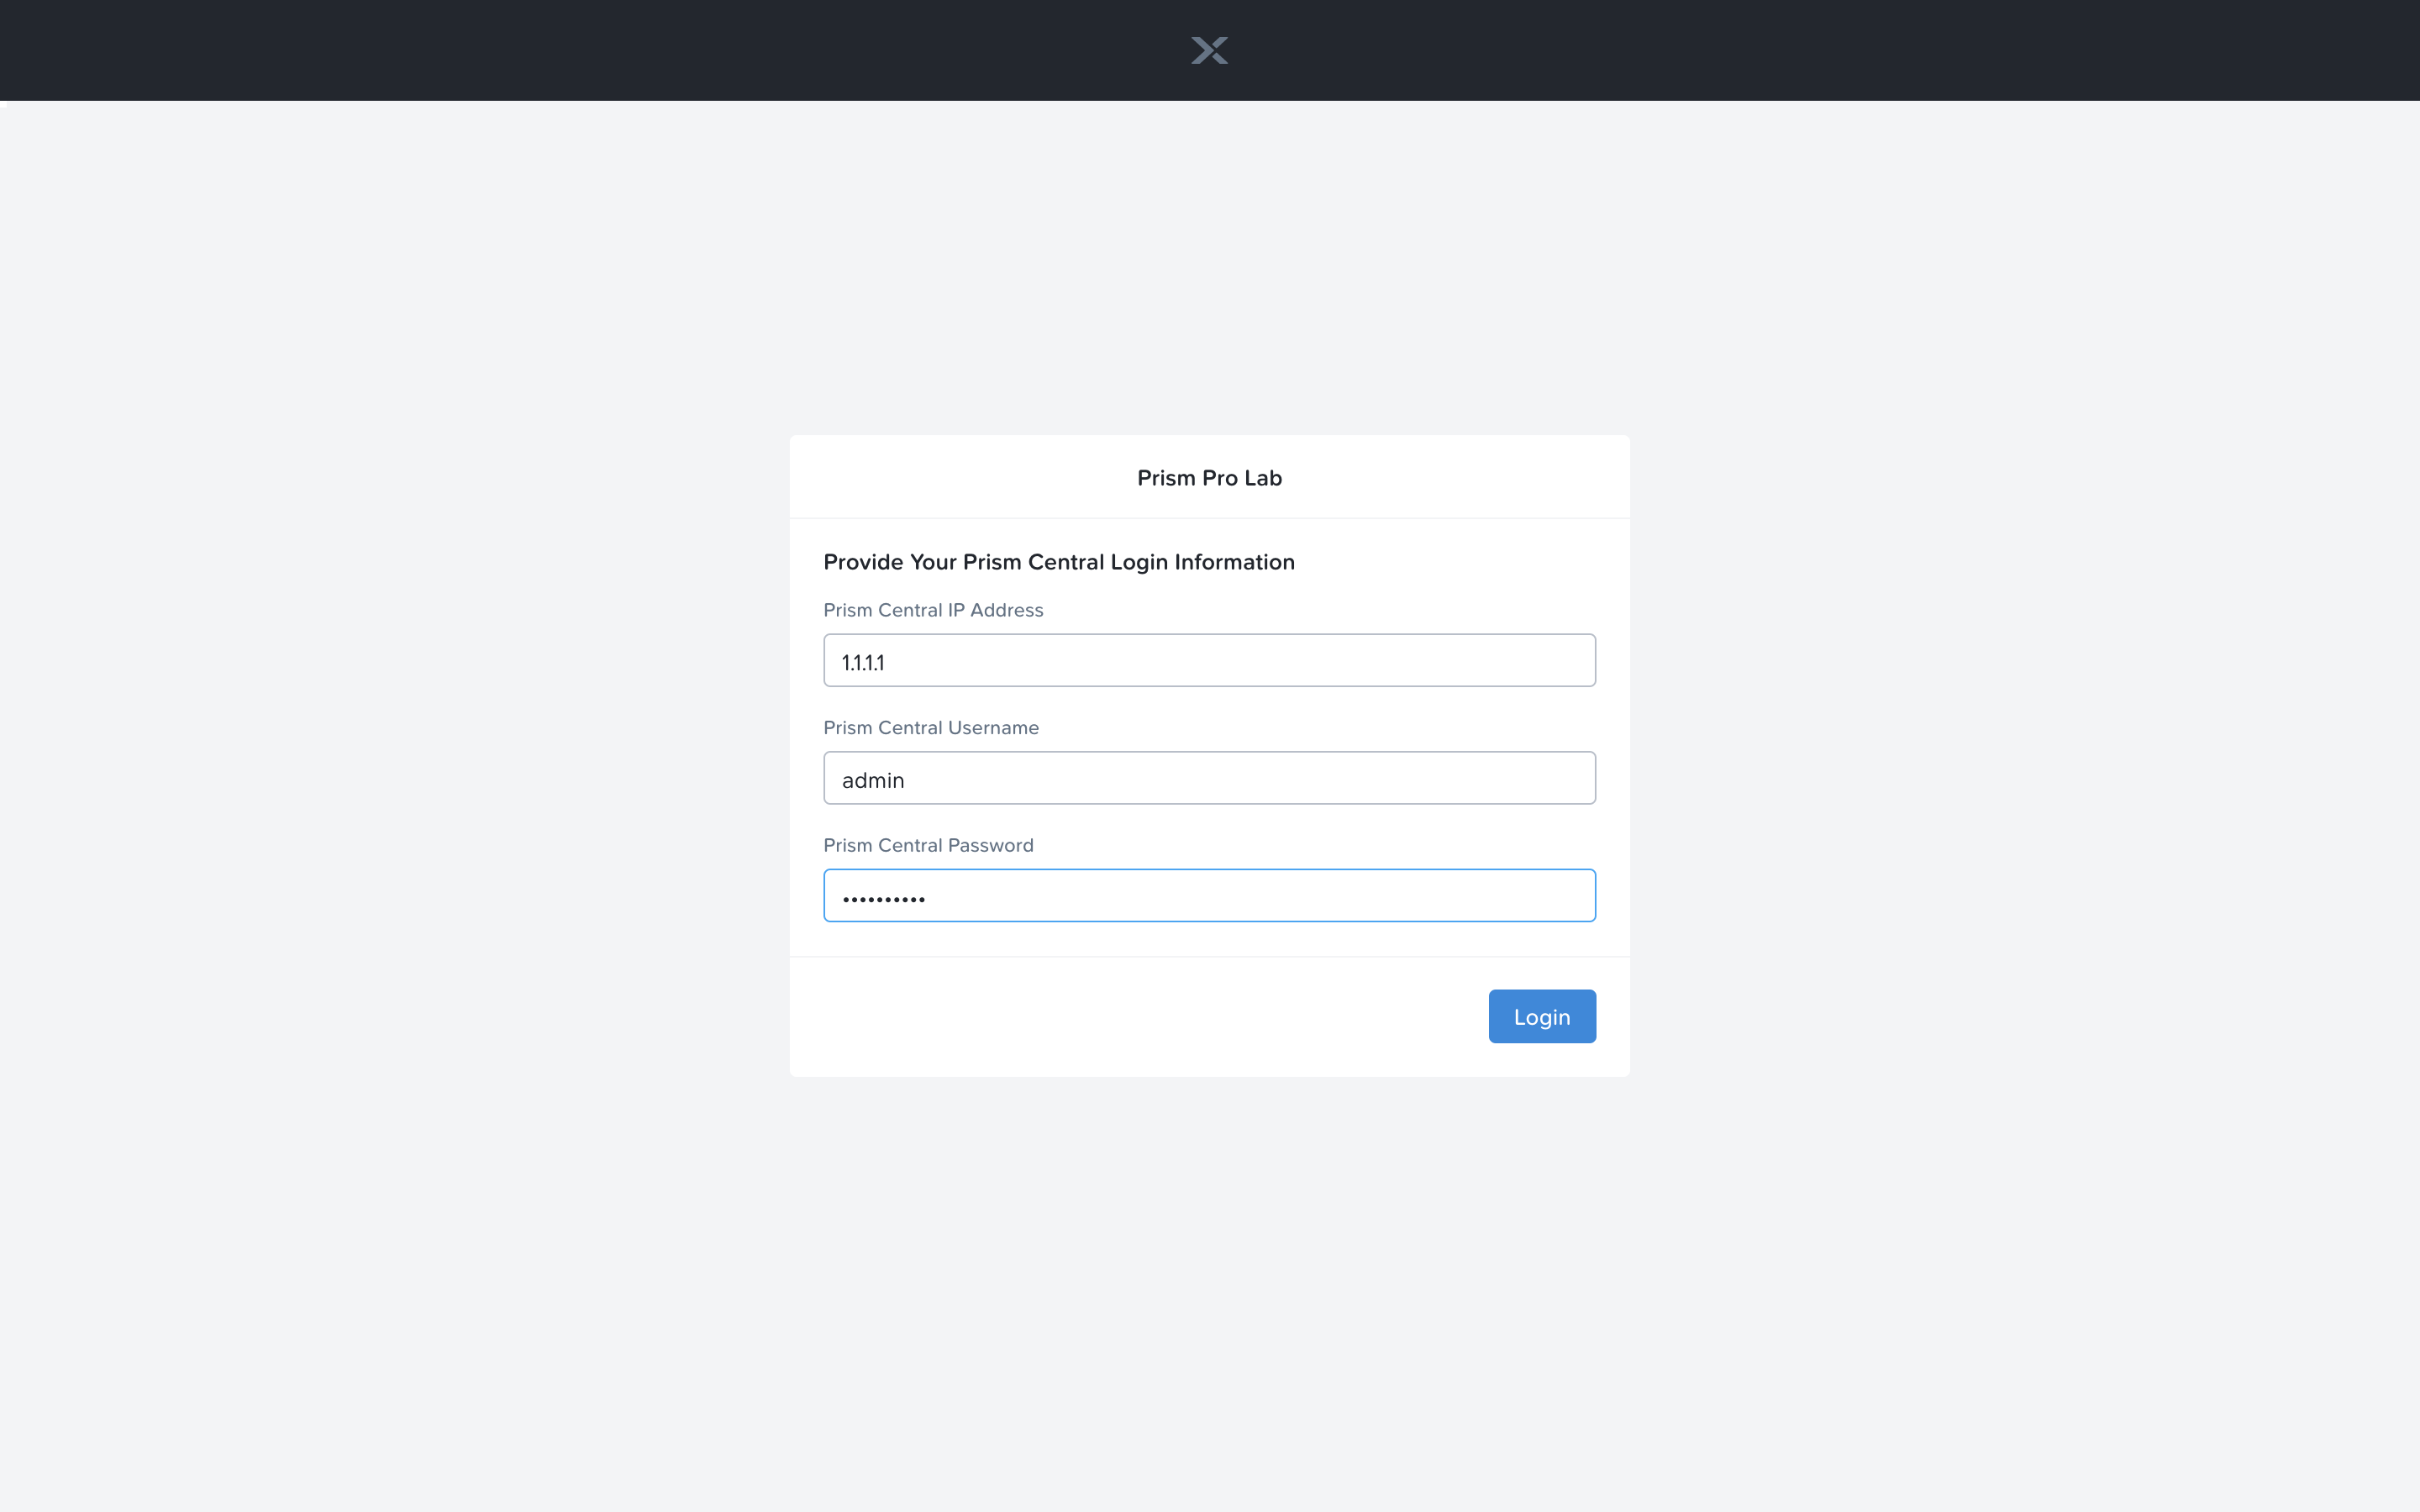
Open a new tab in the browser, and navigate to http://<PrismOpsLabUtilityServer_IP_ADDRESS>/alerts [example http://10.38.17.12/alerts]. It is possible you may need to log into the VM if you are the first one to use it. Just fill out the Prism Central IP, Username and Password and click Login.
Once you have landed on the alerts page, leave the tab open. It will be used in a later portion of this lab.
In a separate tab, navigate to http://<PrismOpsLabUtilityServer_IP_ADDRESS>/ to complete the lab from [example http://10.38.17.12/]. Use the UI at this URL to complete the lab.
Inefficiency Detection with Prism Pro X-FIT
Prism Pro uses X-FIT machine learning to detect and monitor the behaviors of VMs running within the managed clusters.
Using machine learning, Prism Pro then analyzes the data and applies a classification to VMs that are learned to be inefficient. The following are short descriptions of the different classifications:
Overprovisioned: VMs identified as using minimal amounts of assigned resources.
Inactive: VMs that have been powered off for a period of time or that are running VMs that do not consume any CPU, memory, or I/O resources.
Constrained: VMs that could see improved performance with additional resources.
Bully: VMs identified as using an abundance of resources and affecting other VMs.
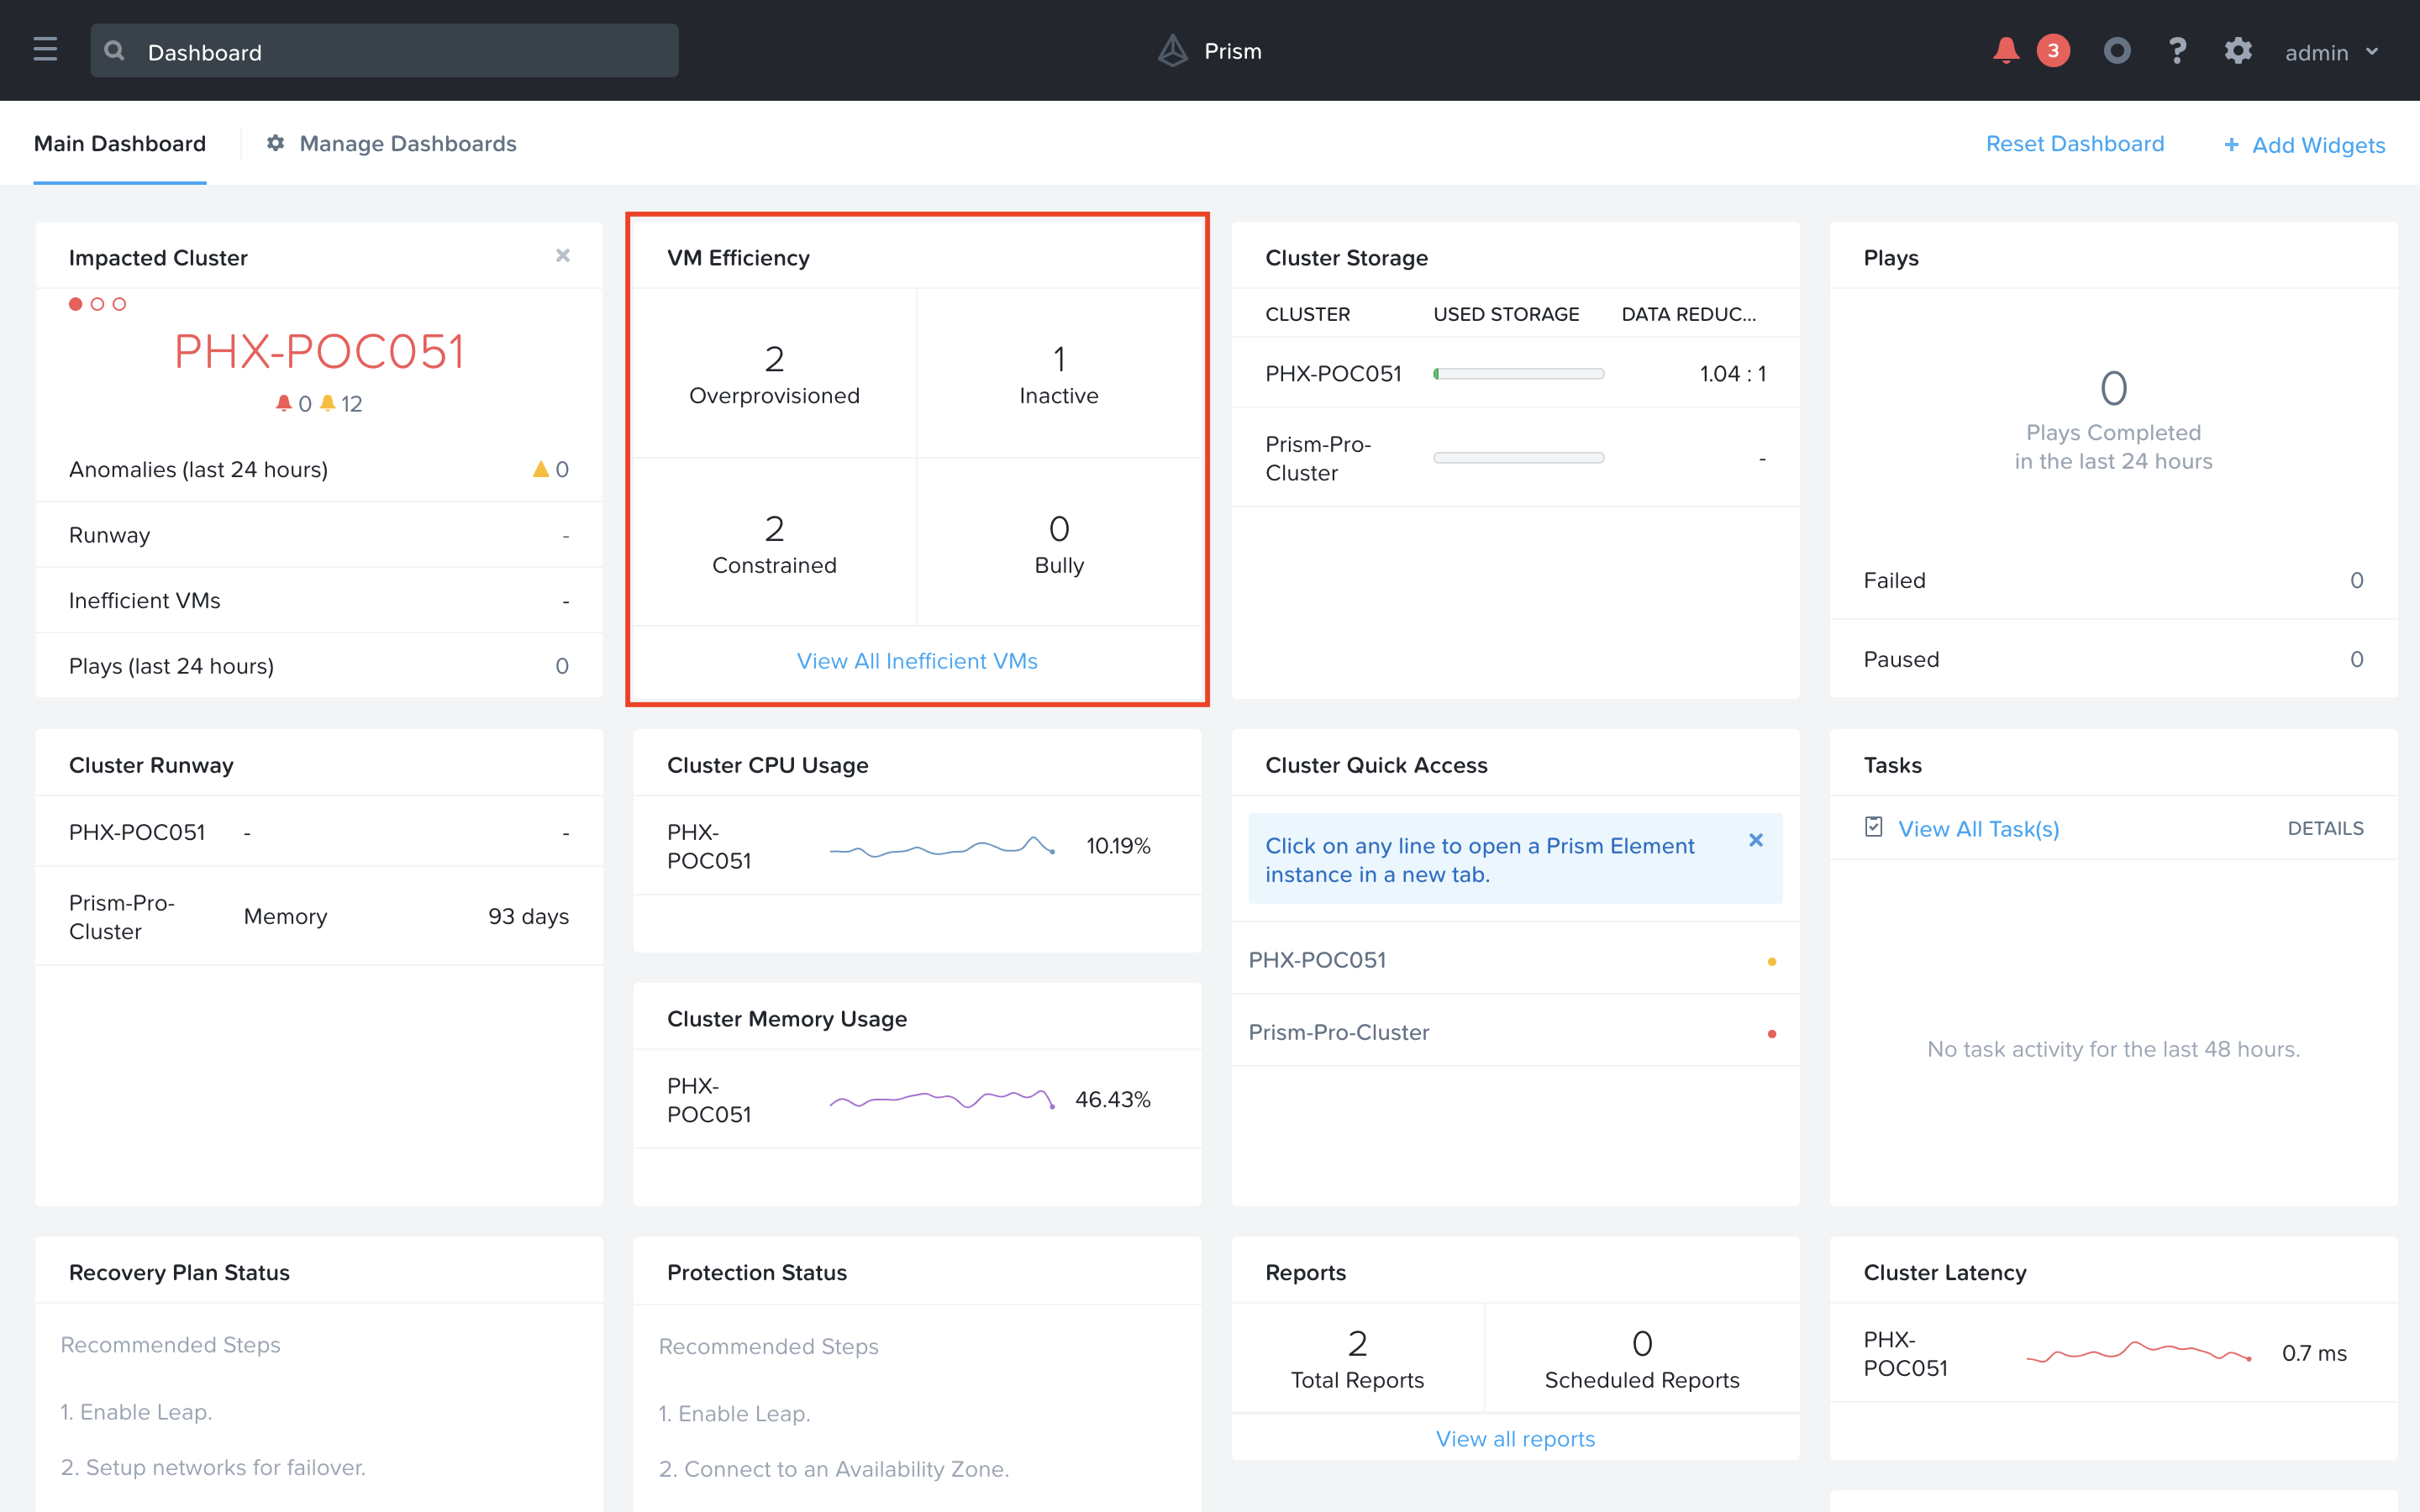
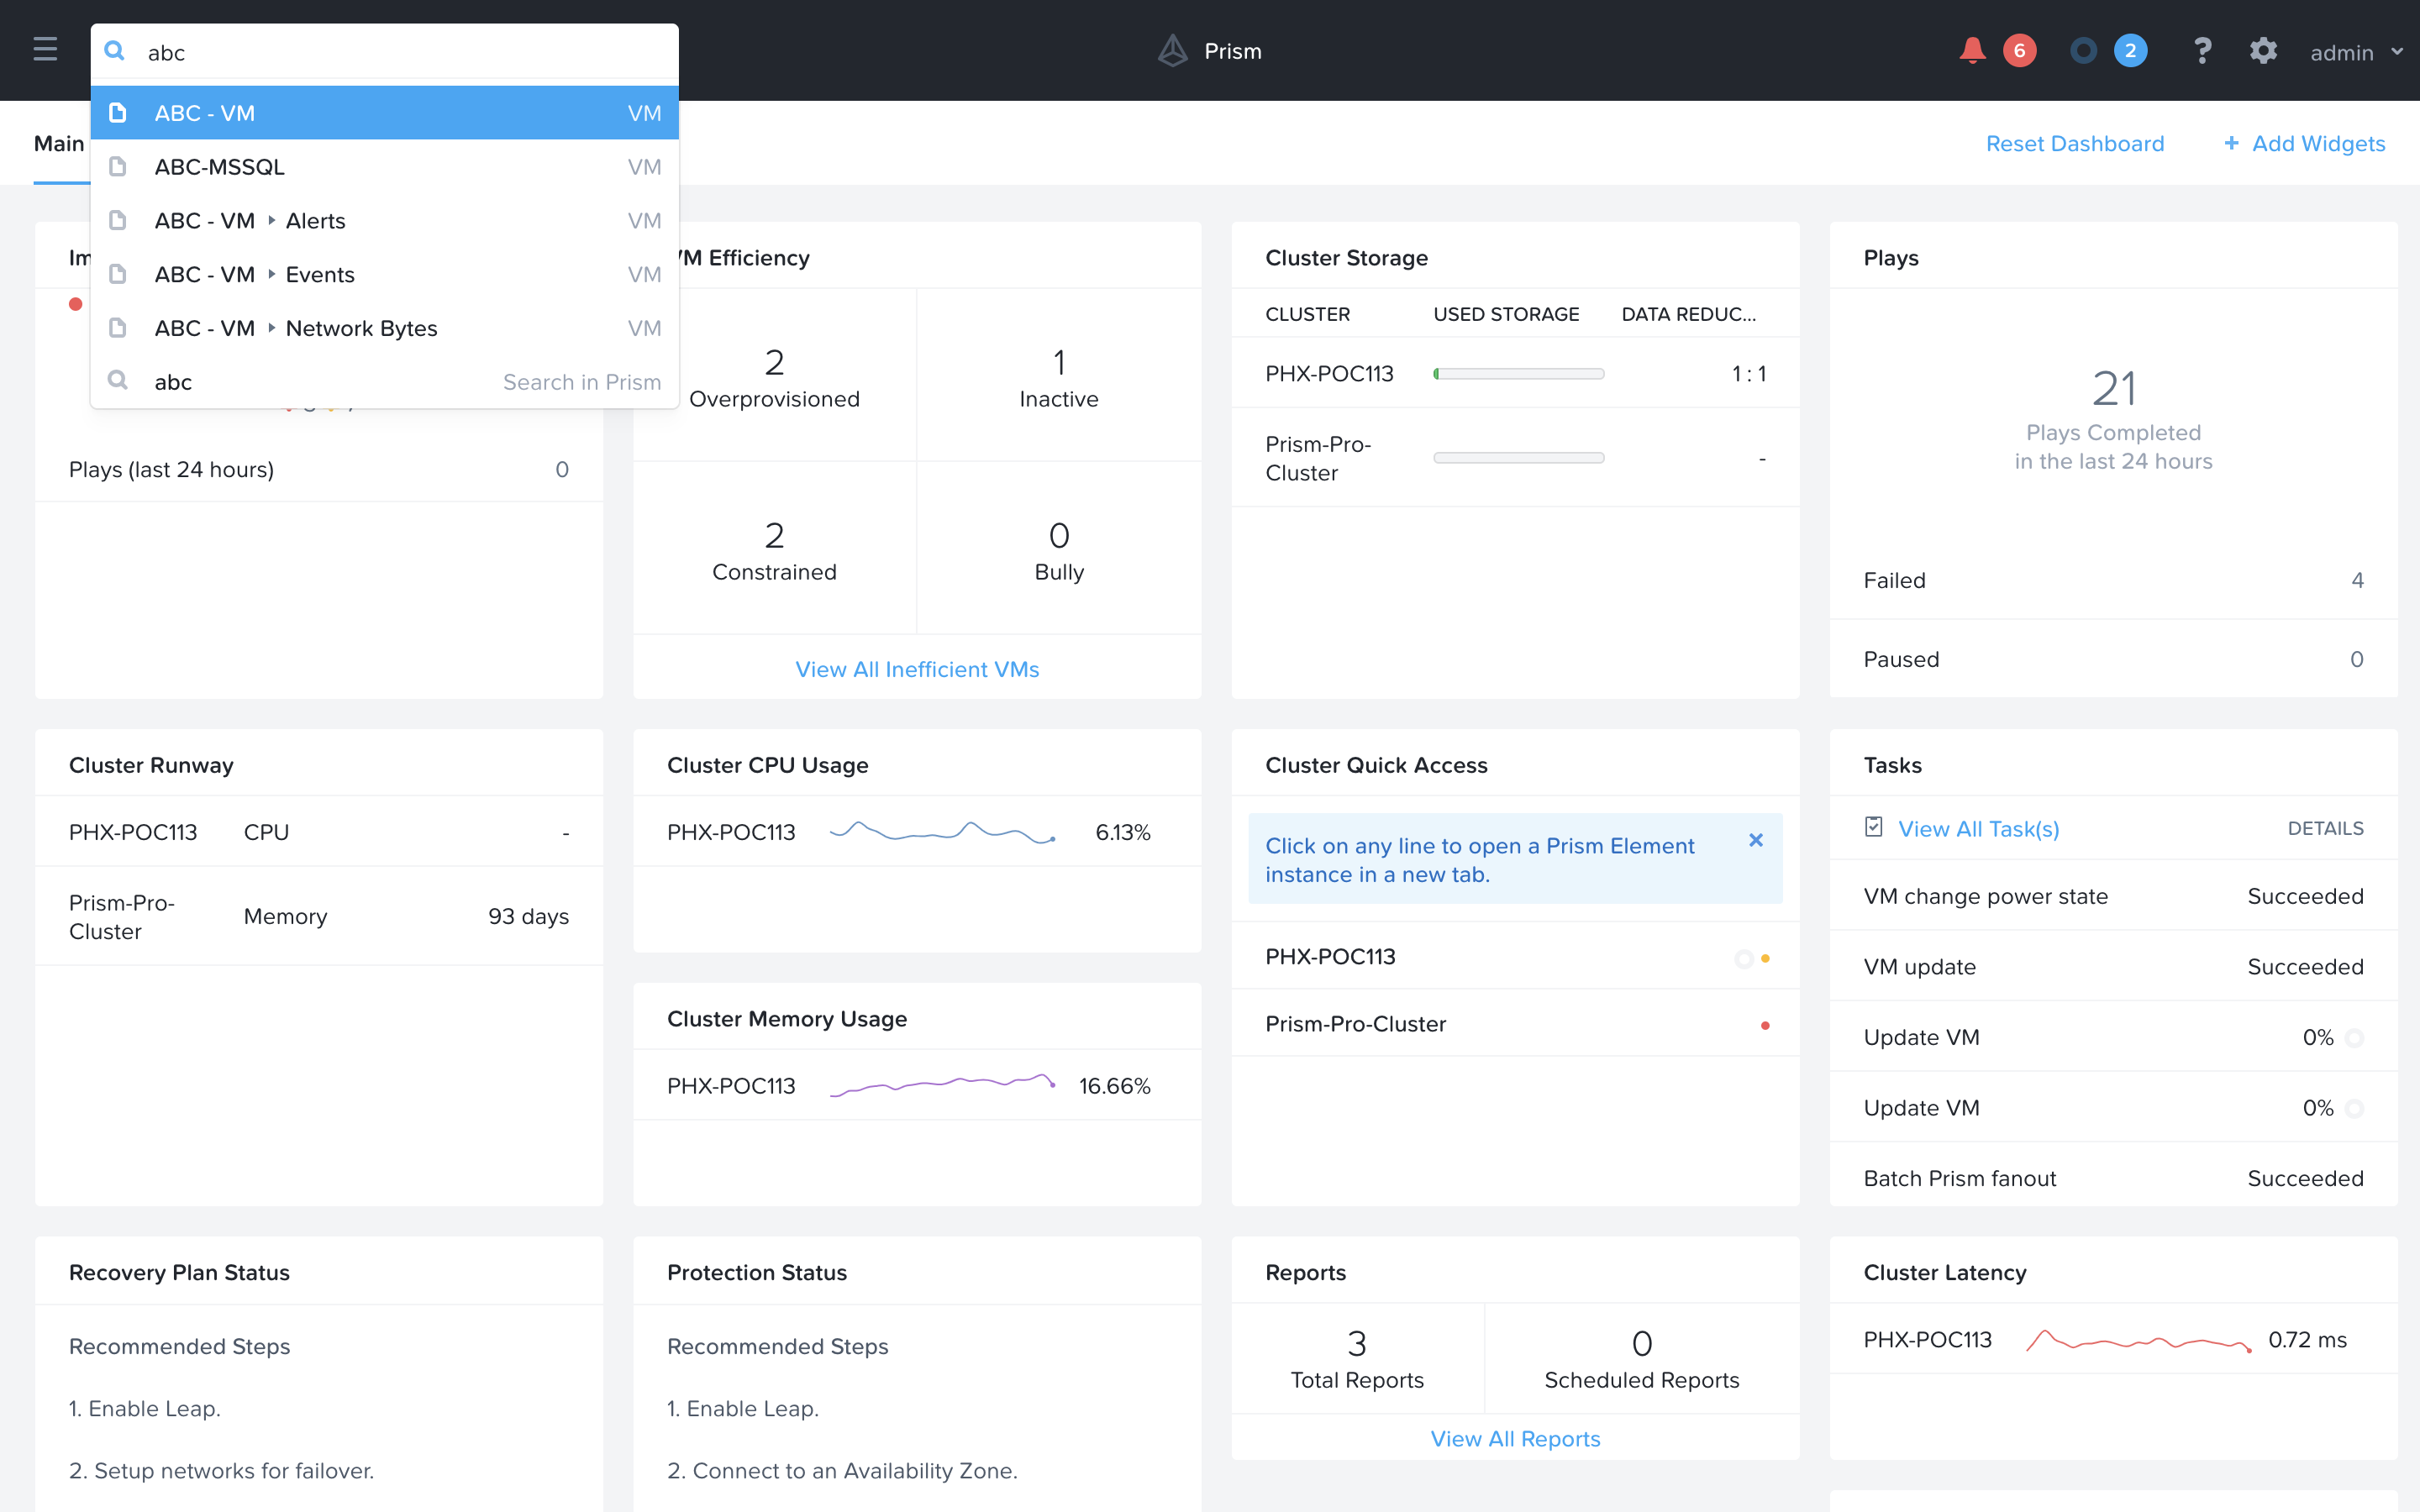
In Prism Central, select > Dashboard (if not already there).
From the Dashboard, take a look at the VM Efficiency widget. This widget gives a summary of inefficient VMs that Prism Pro’s X-FIT machine learning has detected in your environment. Click on the ‘View All Inefficeint VMs’ link at the bottom of the widget to take a closer look.
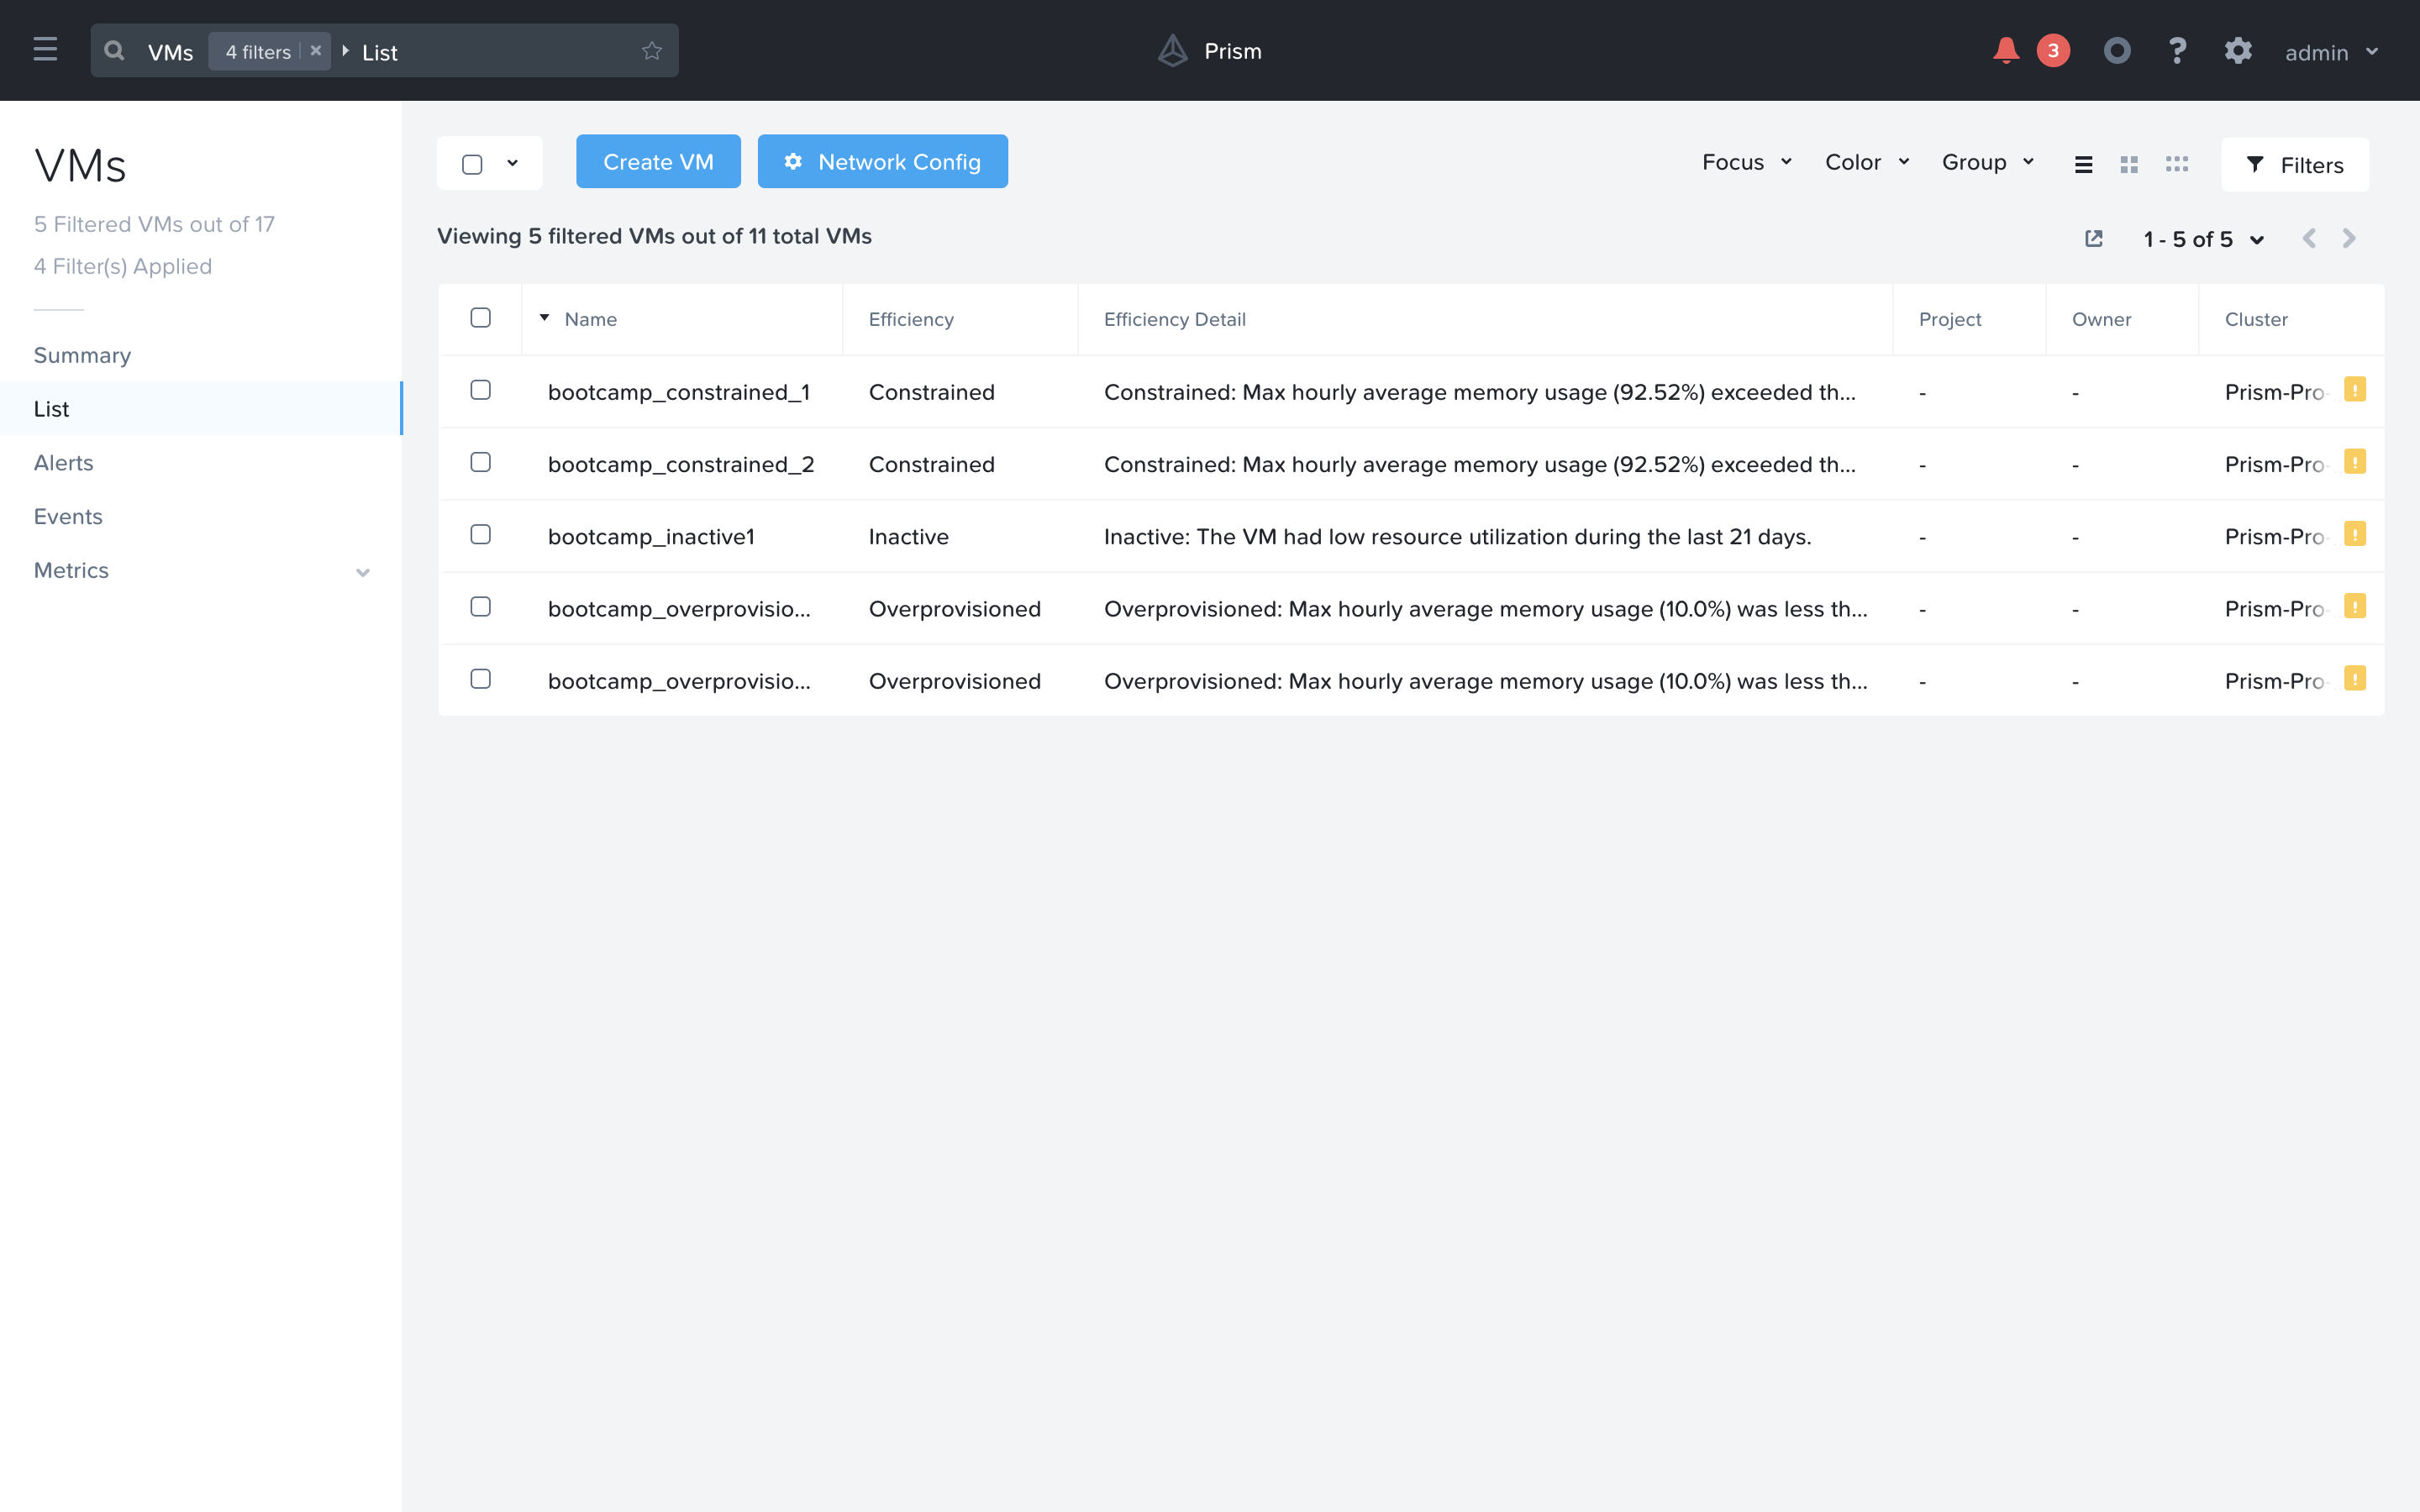
You are now viewing the Efficiency focus in the VMs list view with more details about why Prism Pro flagged these VMs. You can hover the text in the Efficiency detail column to view the full description.
Once an admin has examined the list of VM on the efficiency list they can determine any that they wish to take action against. From VMs that have too many or too little resources they will require the individual VMs to be resized. This can be done in a number of ways with a few examples listed below:
Manually: An admin edits the VM configuration via Prism or vCenter for ESXi VMs and changes the assigned resources.
X-Play: Use X-Plays automated play books to resize VM(s) automatically via a trigger or admins direction. There will be a lab story example of this later in this lab.
Automation: Use some other method of automation such as powershell or REST-API to resize a VM.
Using this machine learning data, Prism Pro is also able to generate baselines, or expected ranges, for VM, Host and Cluster metric data. The X-FIT alogrithms learn the normal behavior of these entities and represent that as a baseline range on the different charts. Whenever a metric value deviates from this expected range, Prism Pro will raise an anomaly.
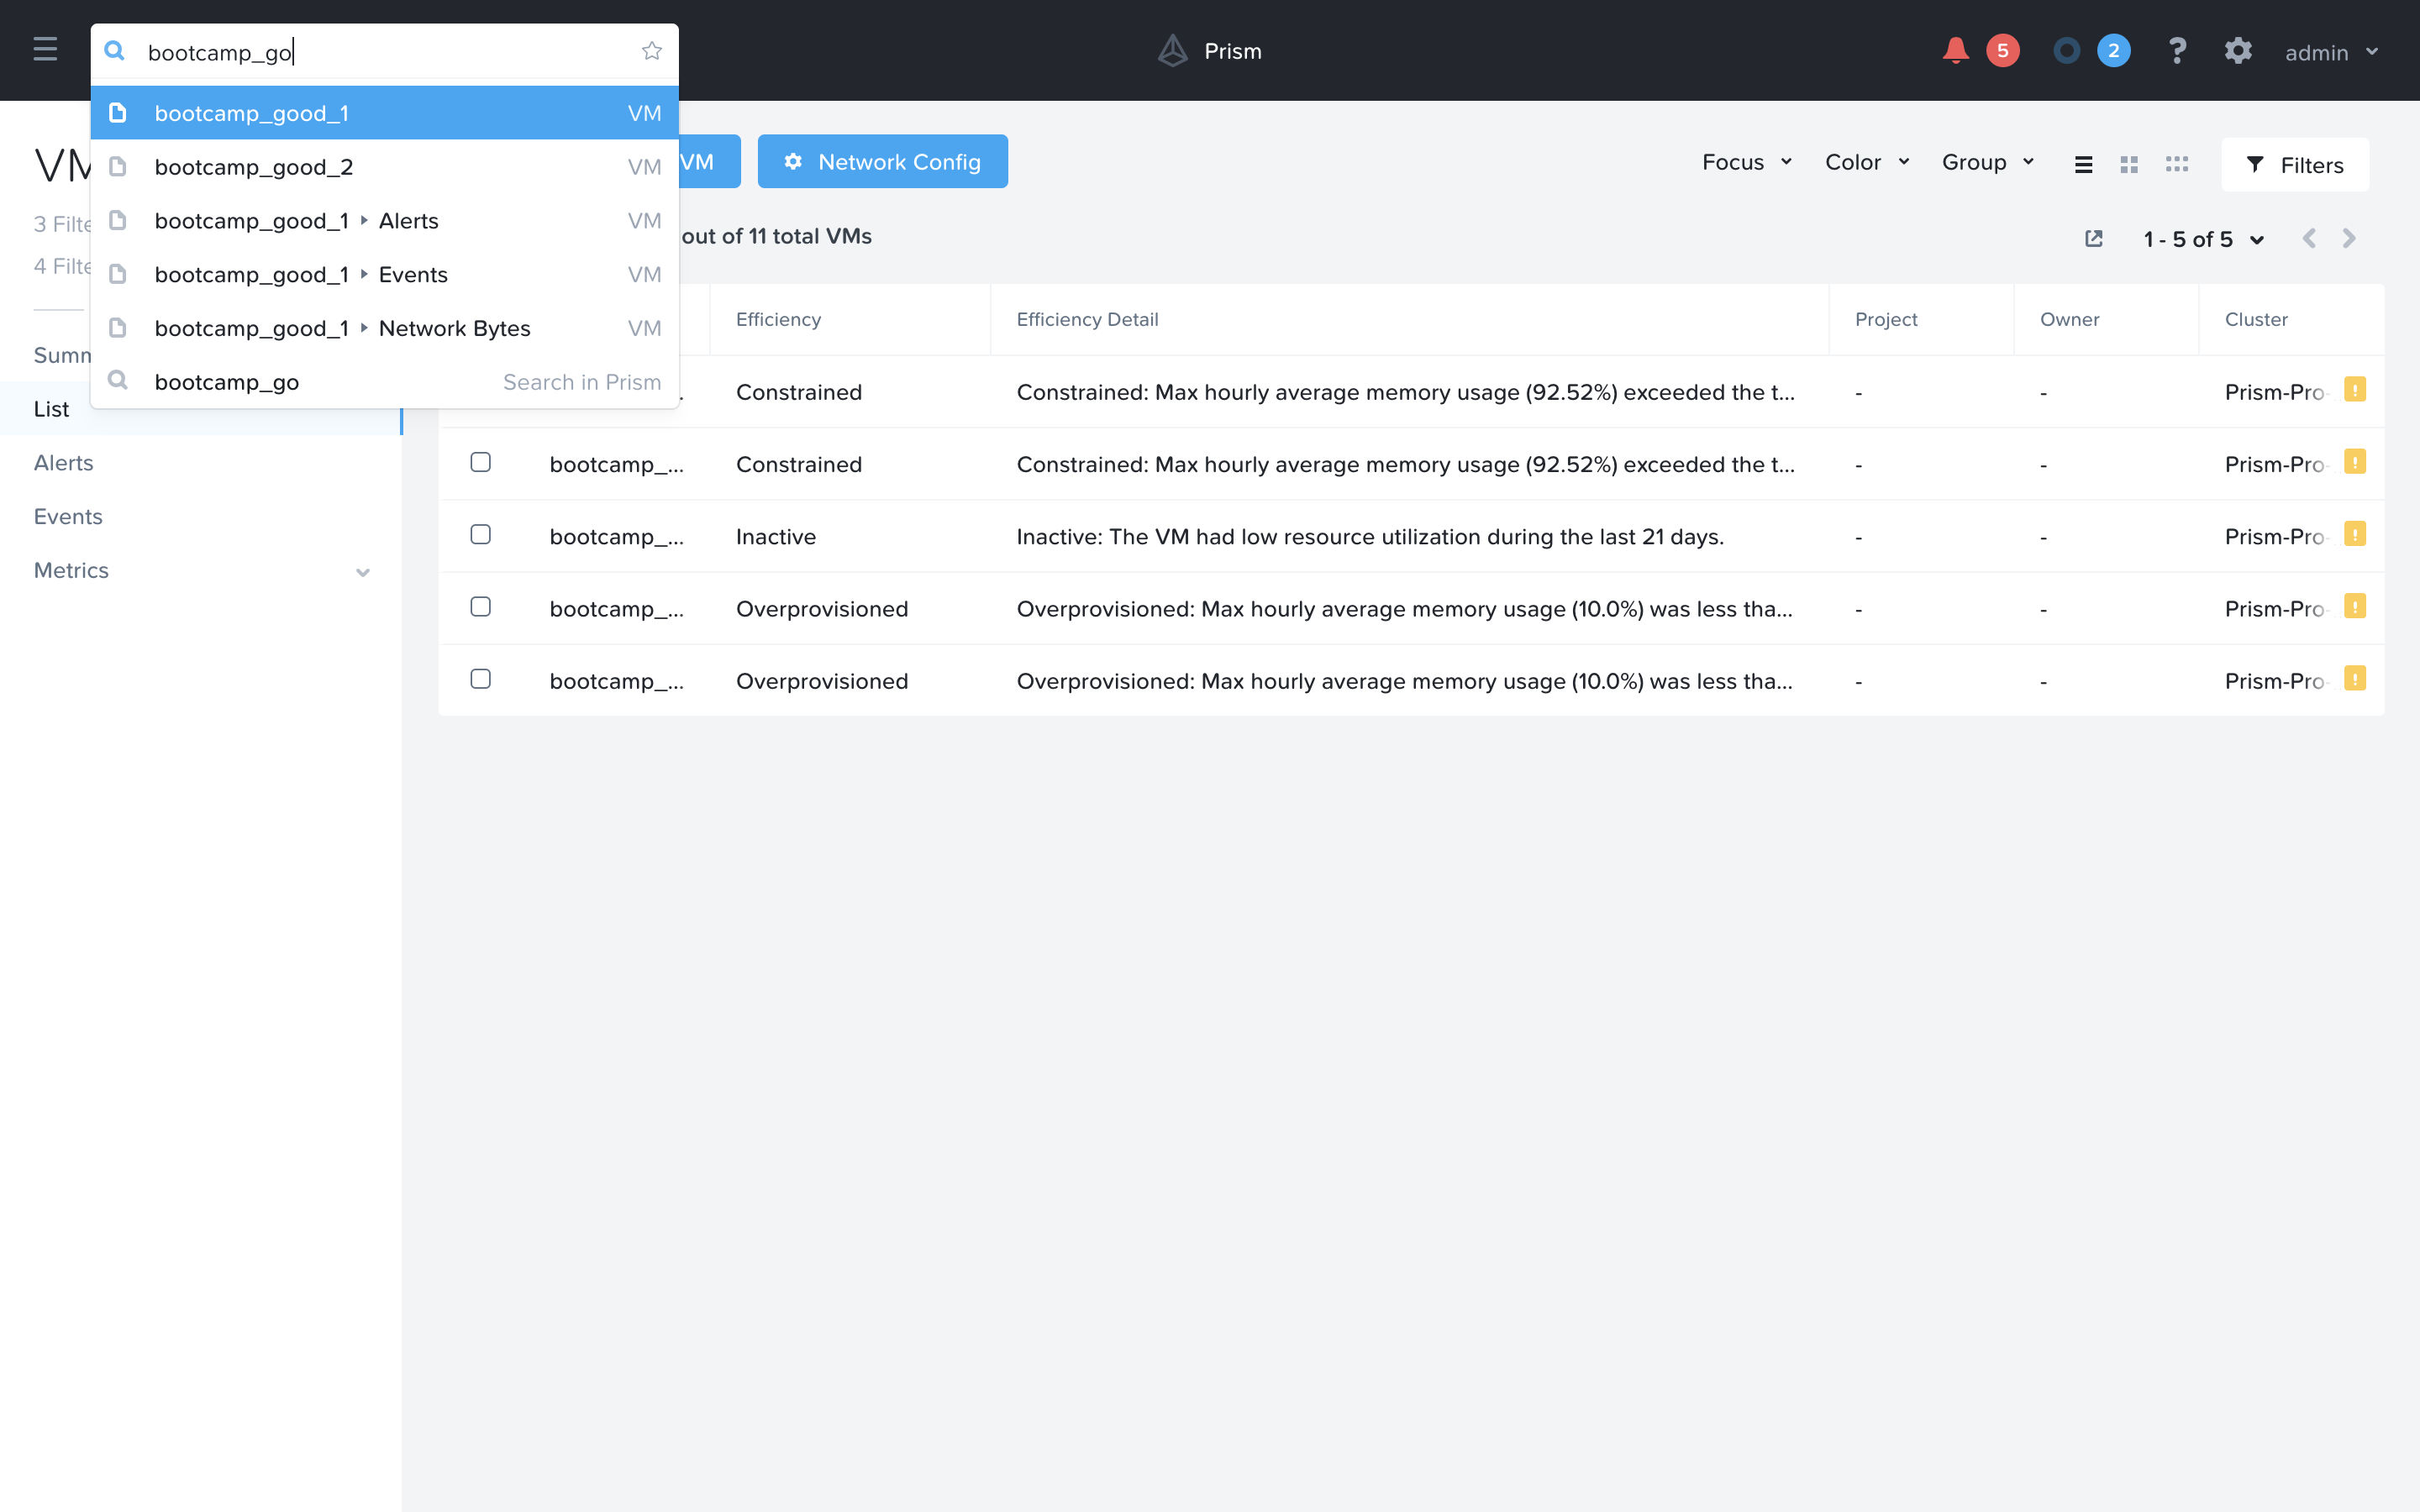
Now let’s take a take a look at a VM by searching for ‘bootcamp_good’ and selecting ‘bootcamp_good_1’.
Go to Metrics > CPU Usage. Notice a dark blue line, and a lighter blue area around it. The dark blue line is the CPU Usage. The light blue area is the expected CPU Usage range for this VM. This particular VM is running an application that is upgraded at the same time each day, which explains the usage pattern. Notice that X-FIT detects the seasonality in this usage pattern and has adjusted the expected range accordingly. In this case, an anomaly has been raised for this VM, because the Usage is far above the expected range. You can also reduce the time range “Last 24 hours” to examine the chart more closely.
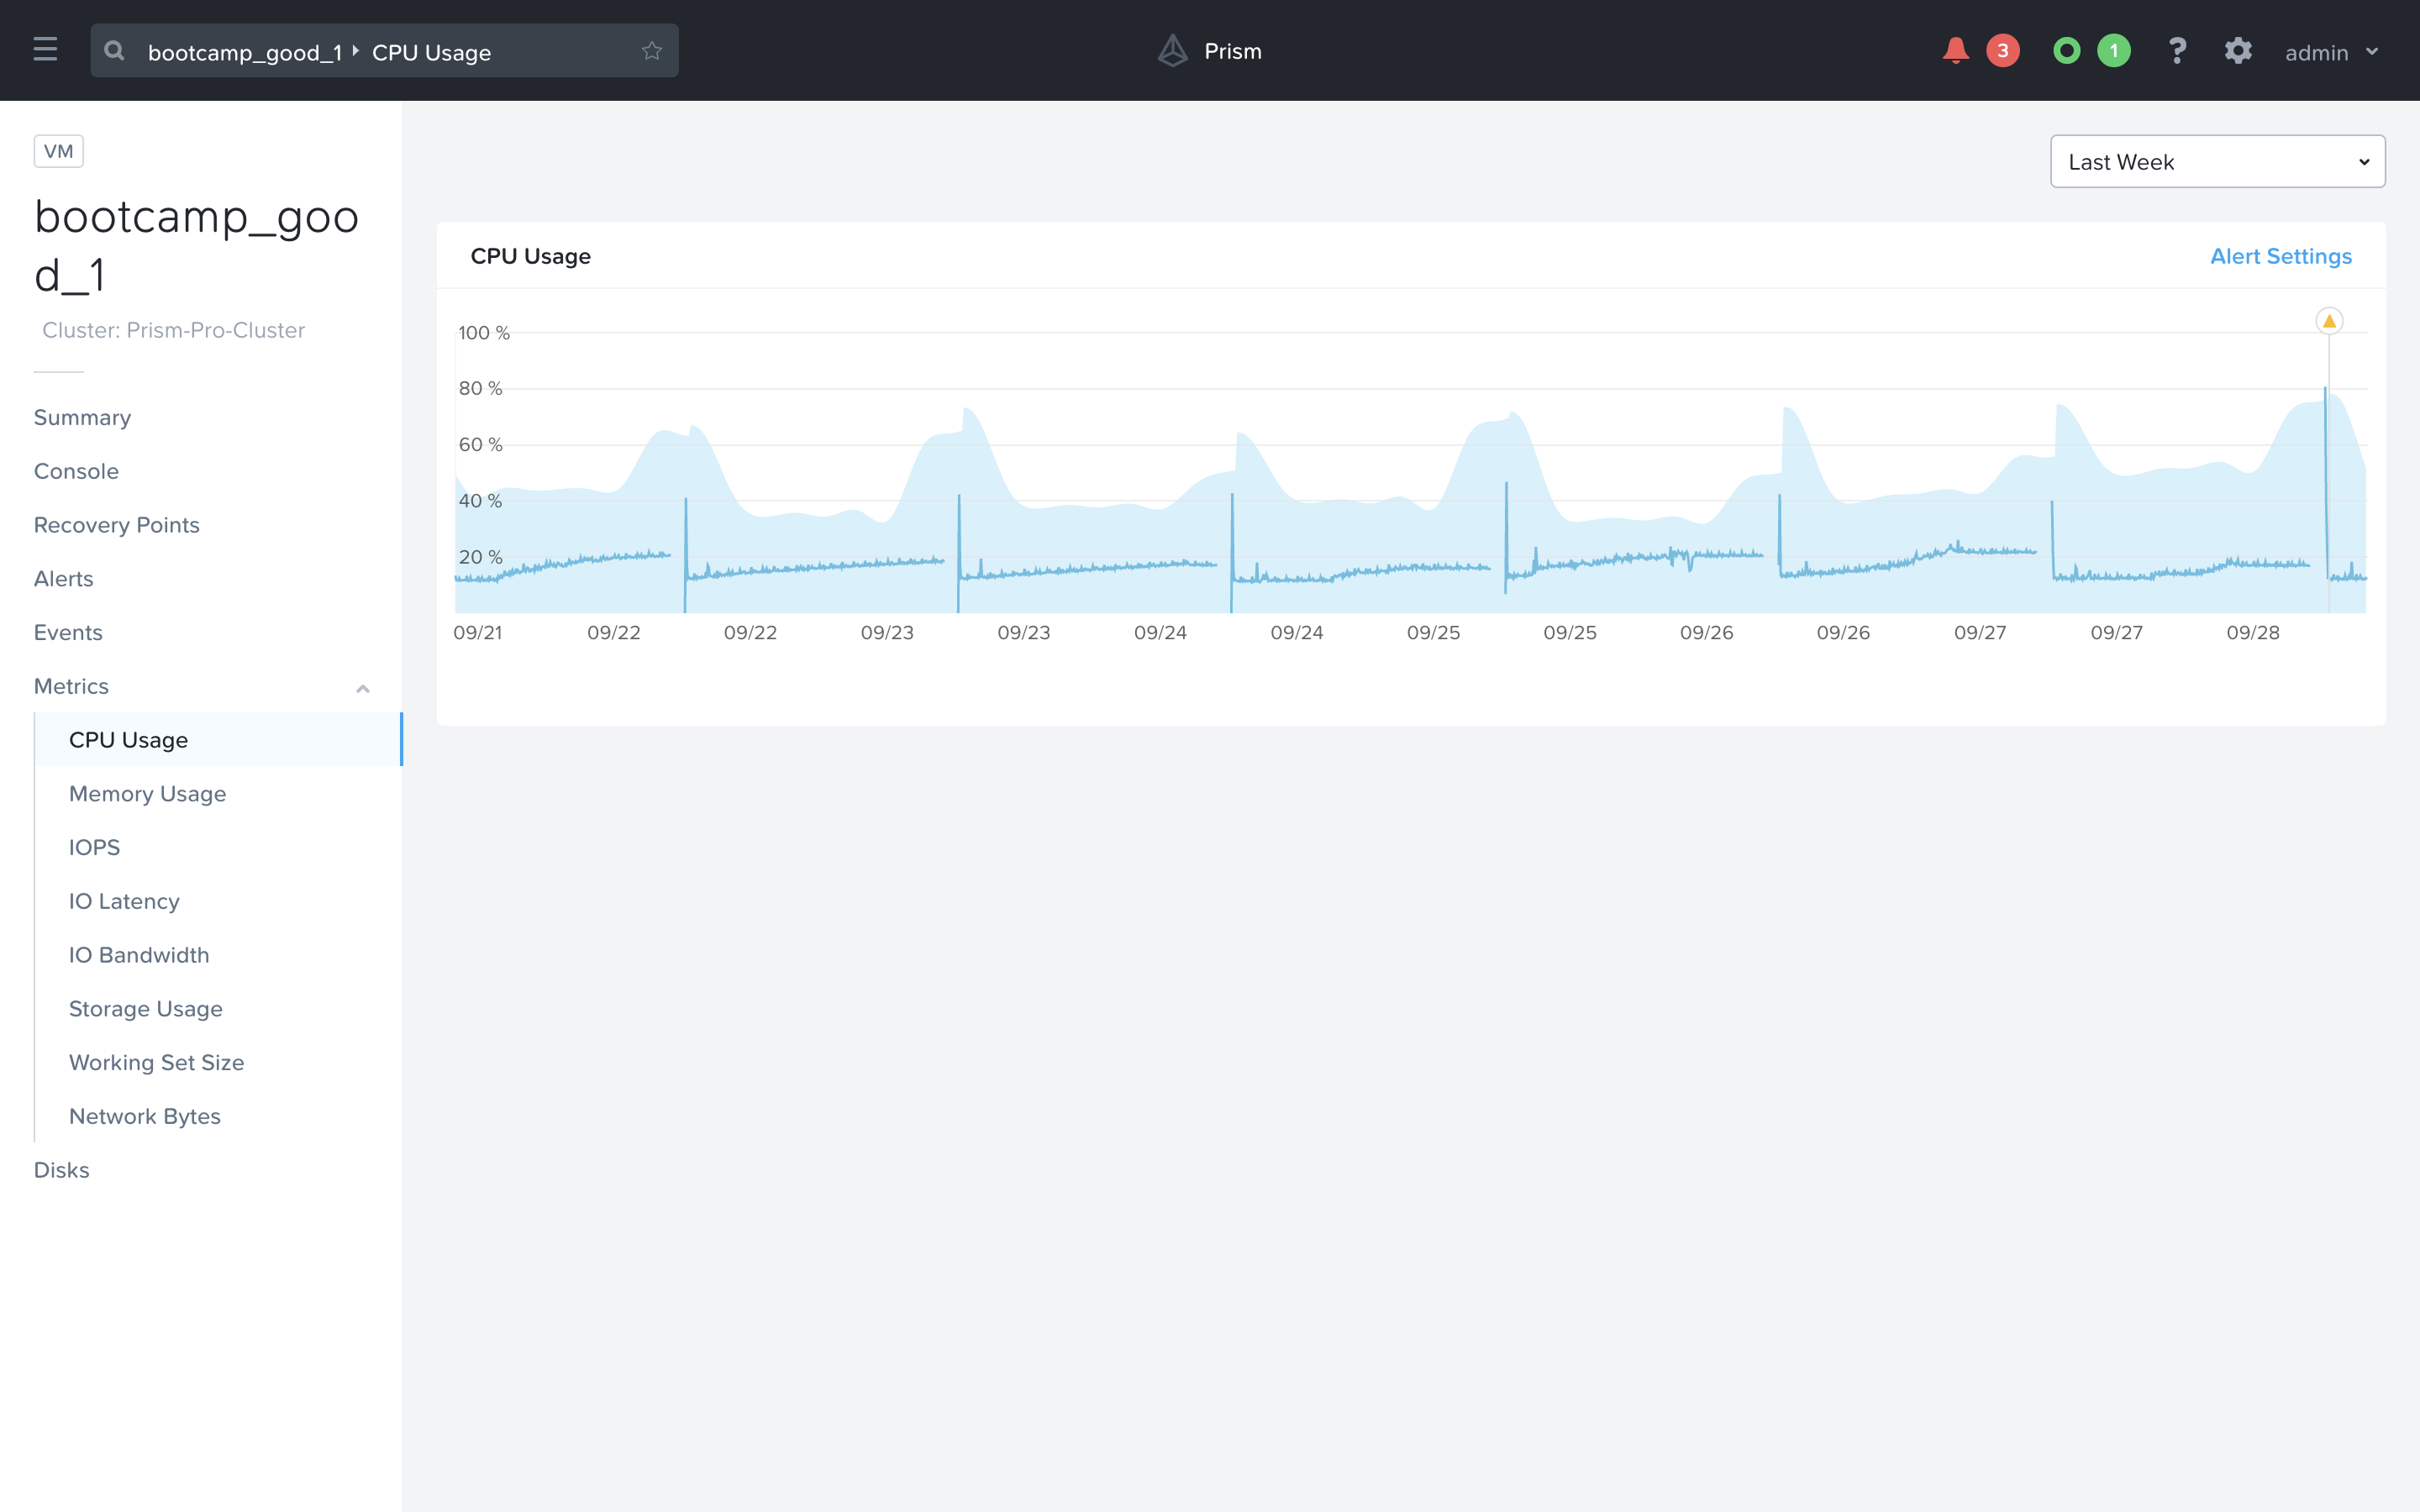
Click “Alert Setting” to set an alert policy for this kind of situation.
In the right hand side, you can change some of the configurations however you would like. In this example I have changed the Behavioral Anomaly threshold to ignore anomalies between 10% and 70%. All other anomalies will generate a Warning alert. I have also adjusted the Static threshold to Alert Critical if the CPU Usage on this VM exceeds 95%.
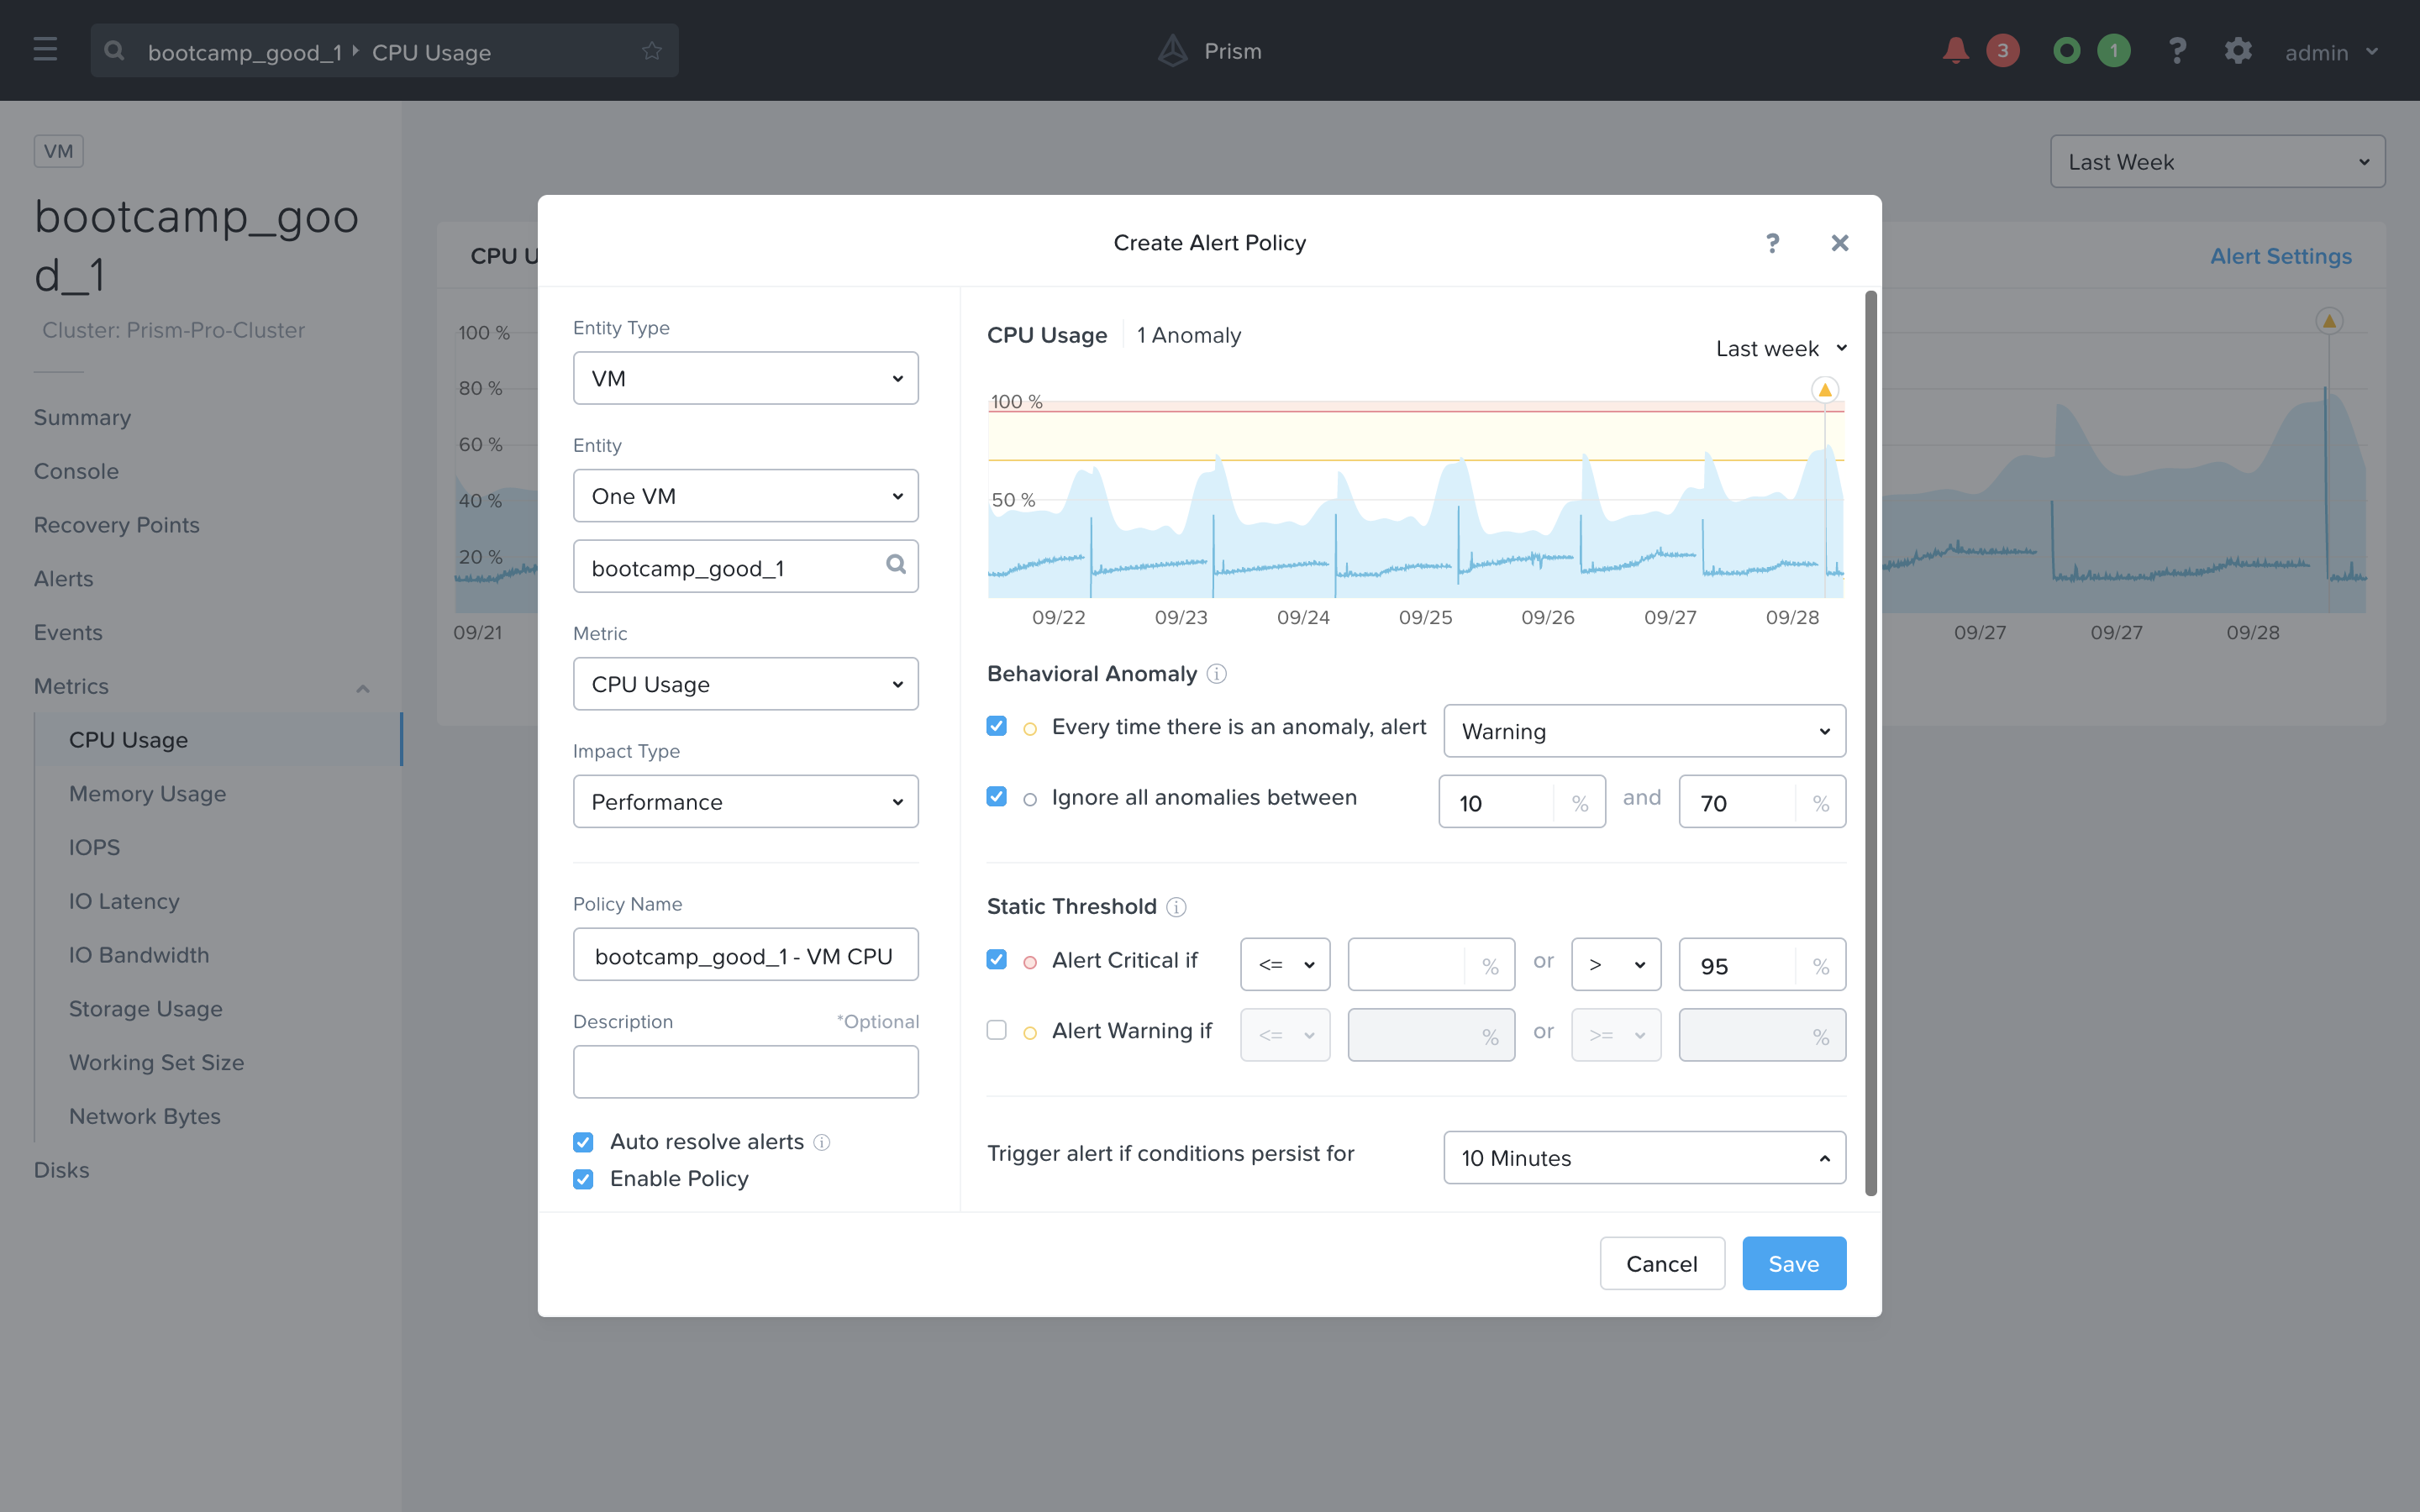
Hit Cancel to exit the policy creation workflow.
Automatically Increase Constrained VM Memory with X-Play
Now let’s look at how we can take automated action to resolve some of these inefficiencies. For this lab we will assume that this VM is constrained for memory and will show how we can automatically remediate the right sizing of this VM. We will also use a custom Ticket system to give an idea of how this typical workflow could integrate with ticketing system such as Service Now.
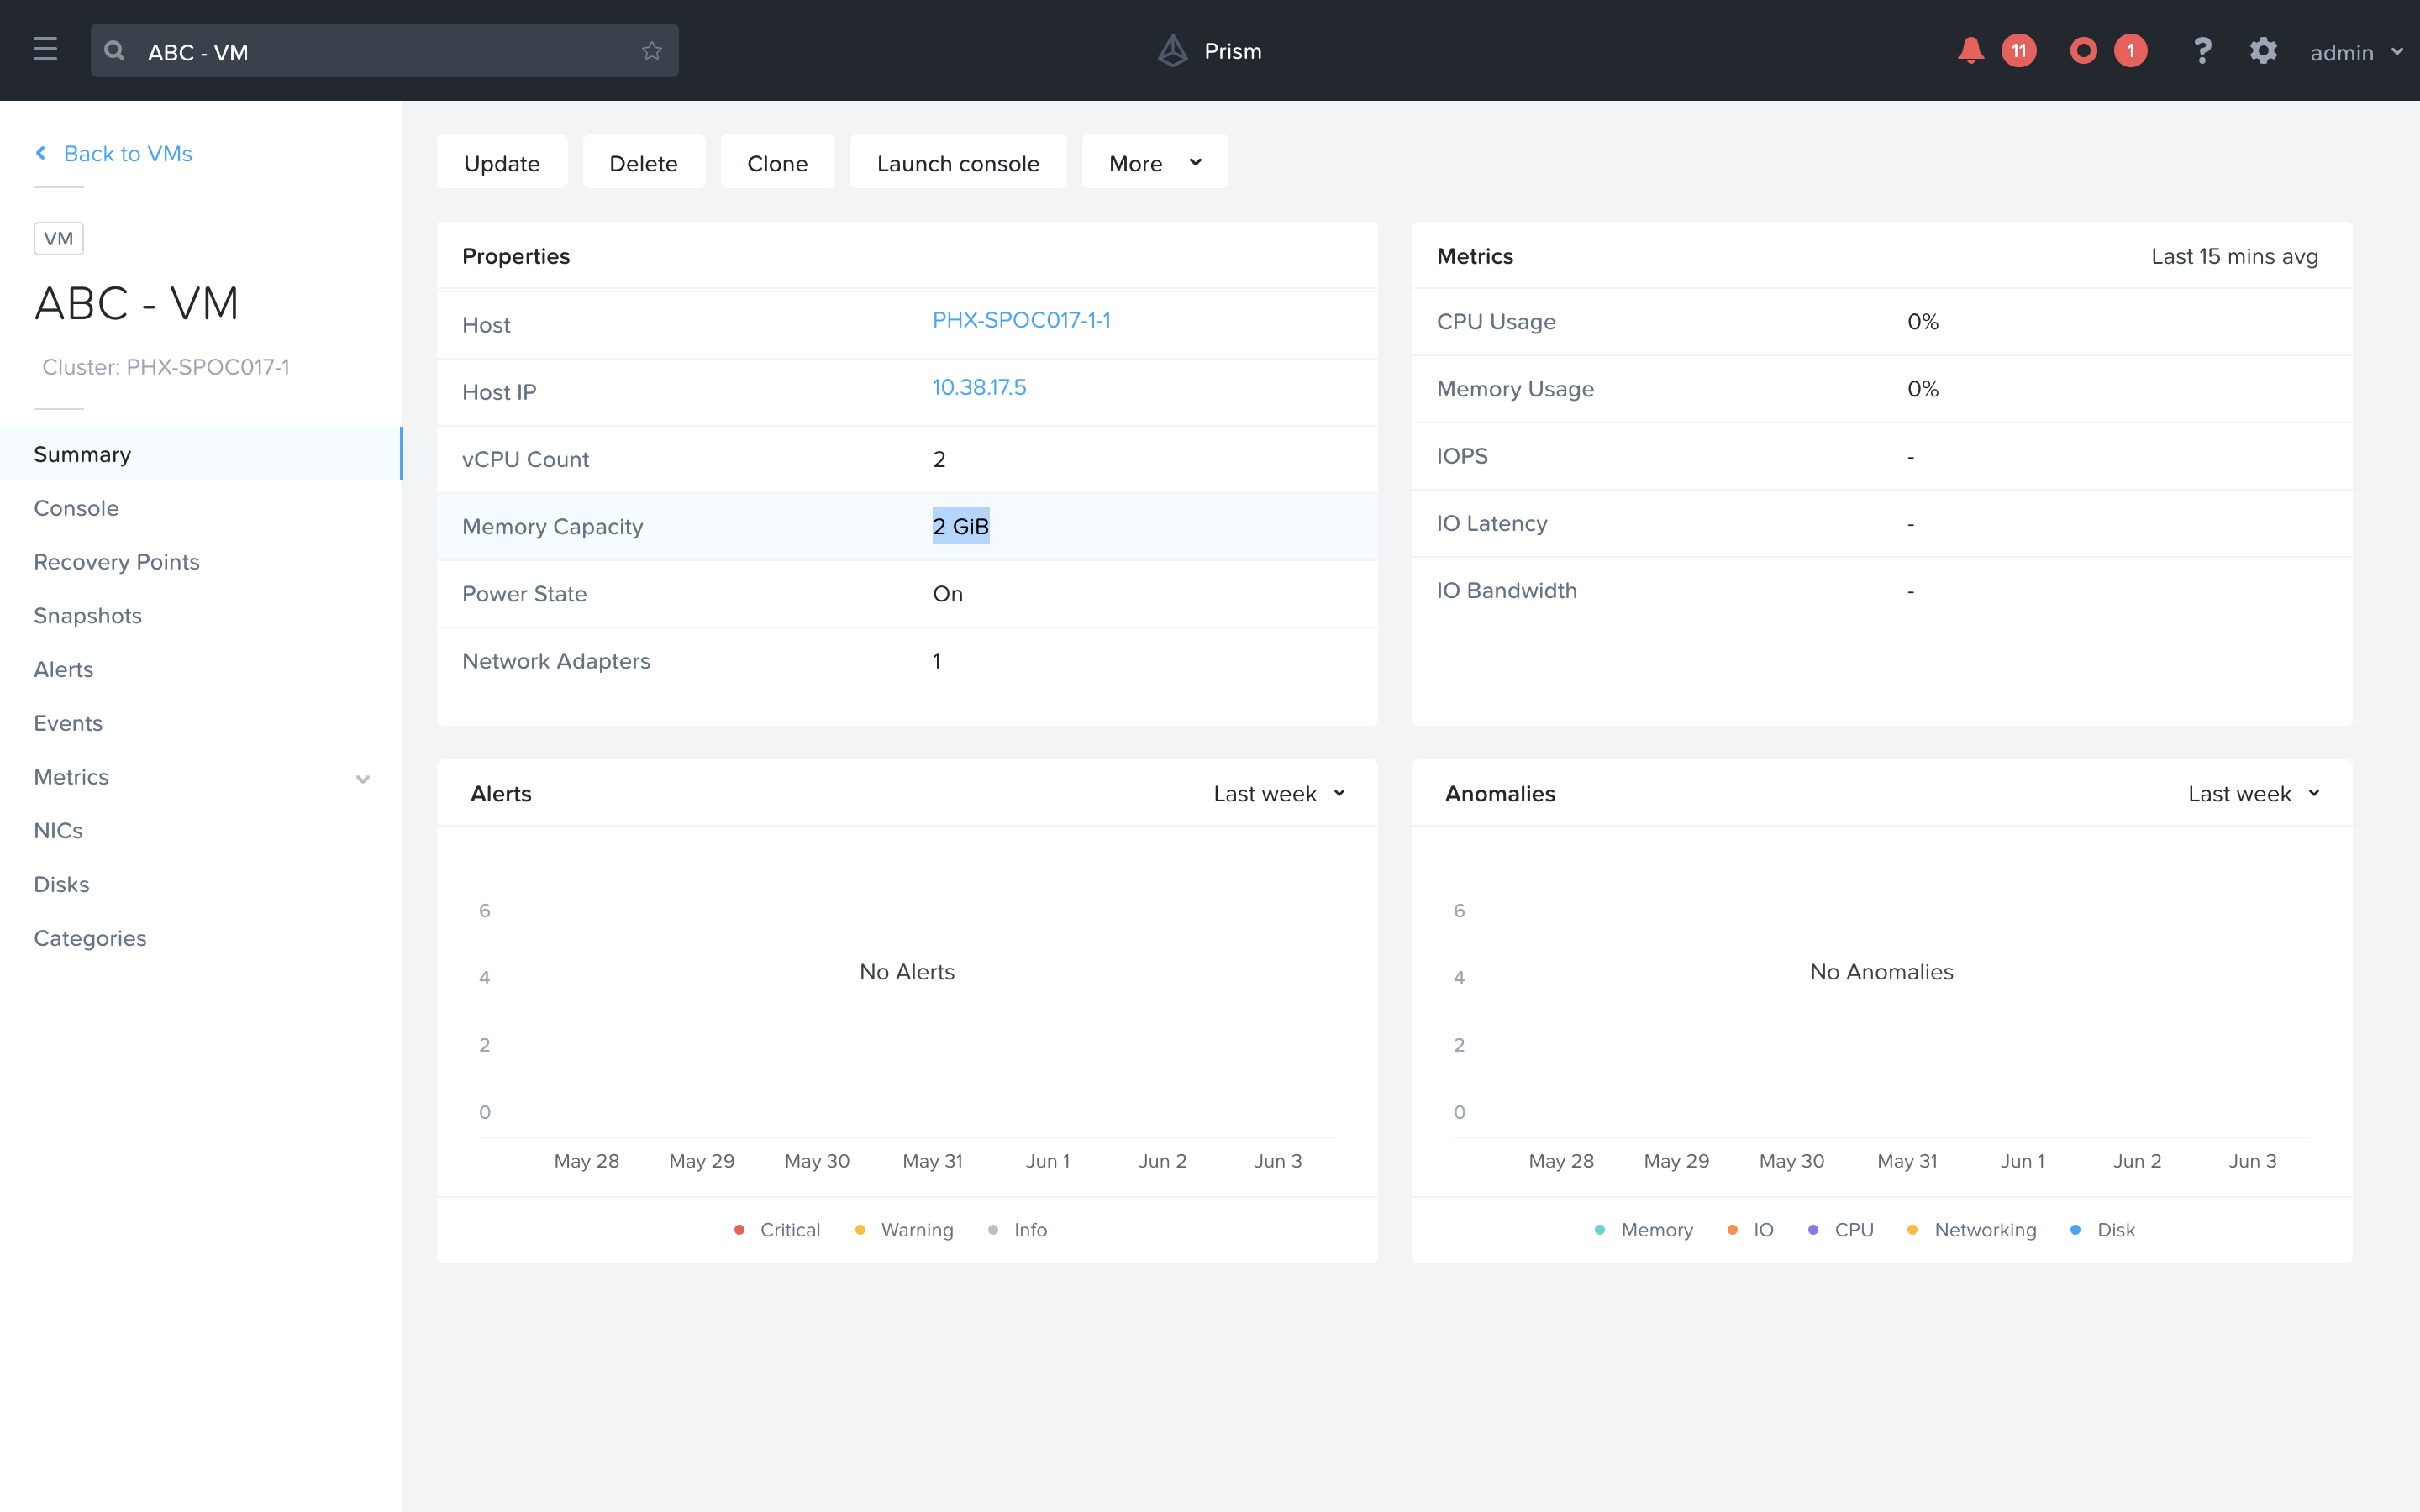
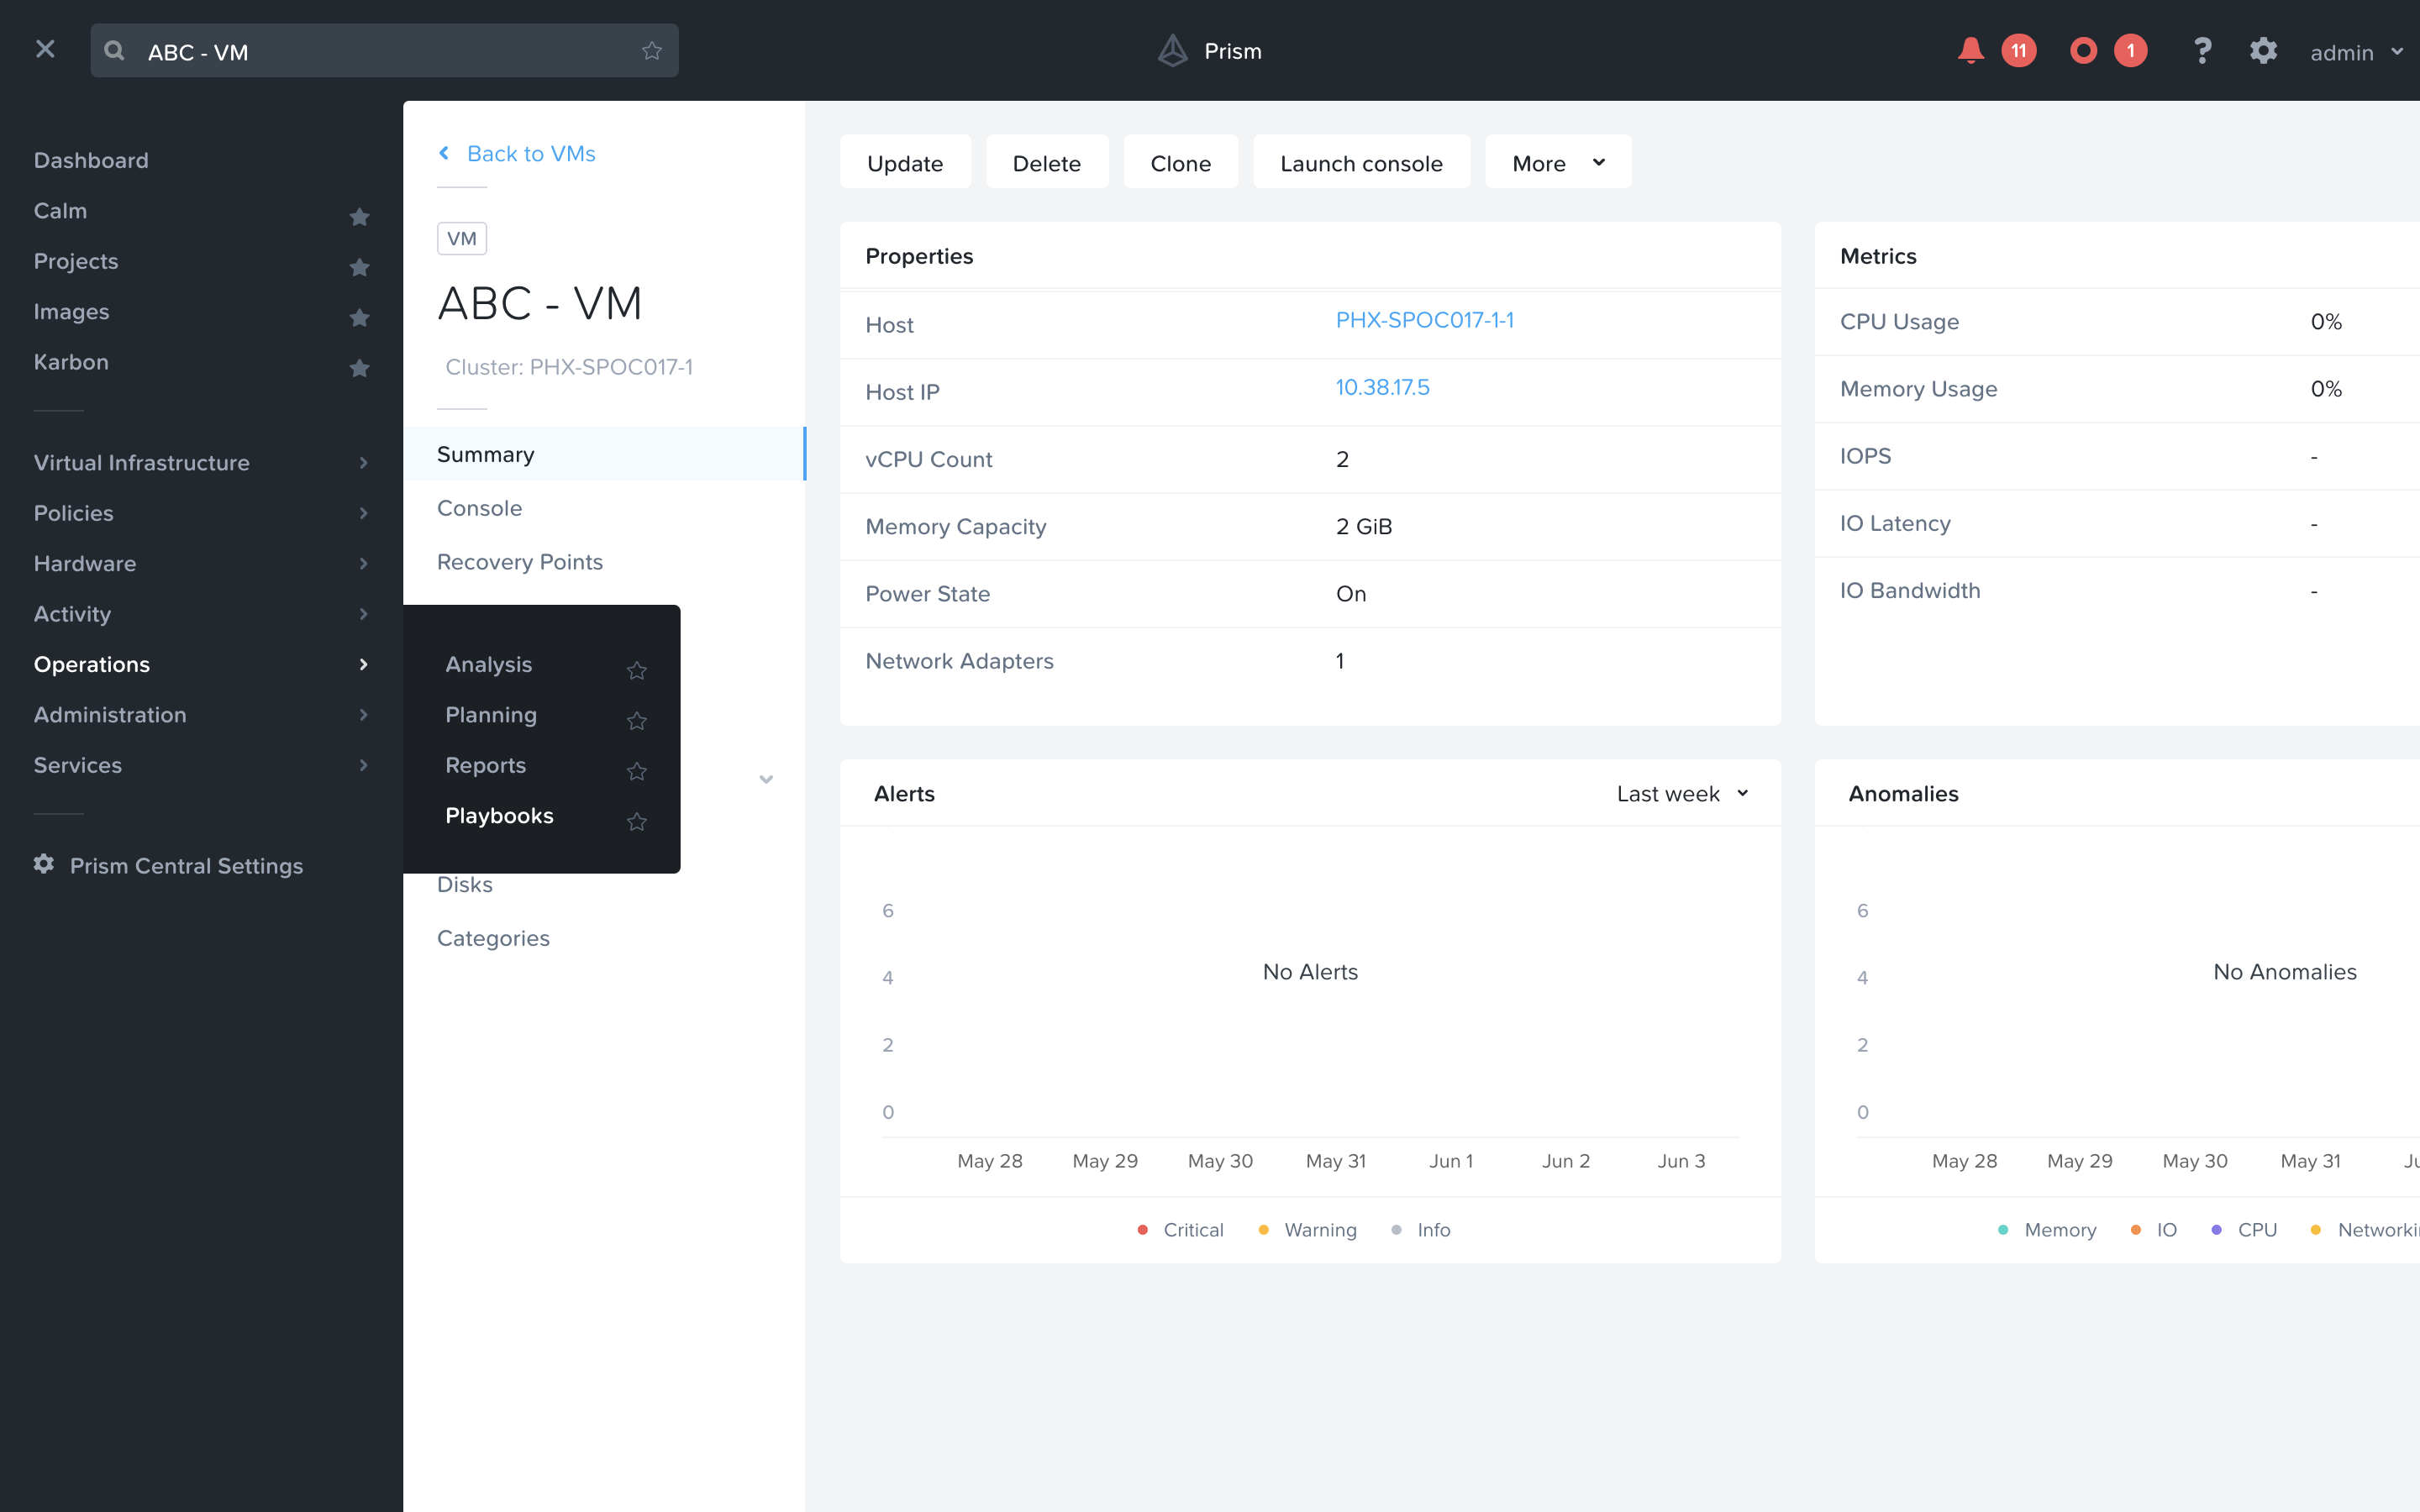
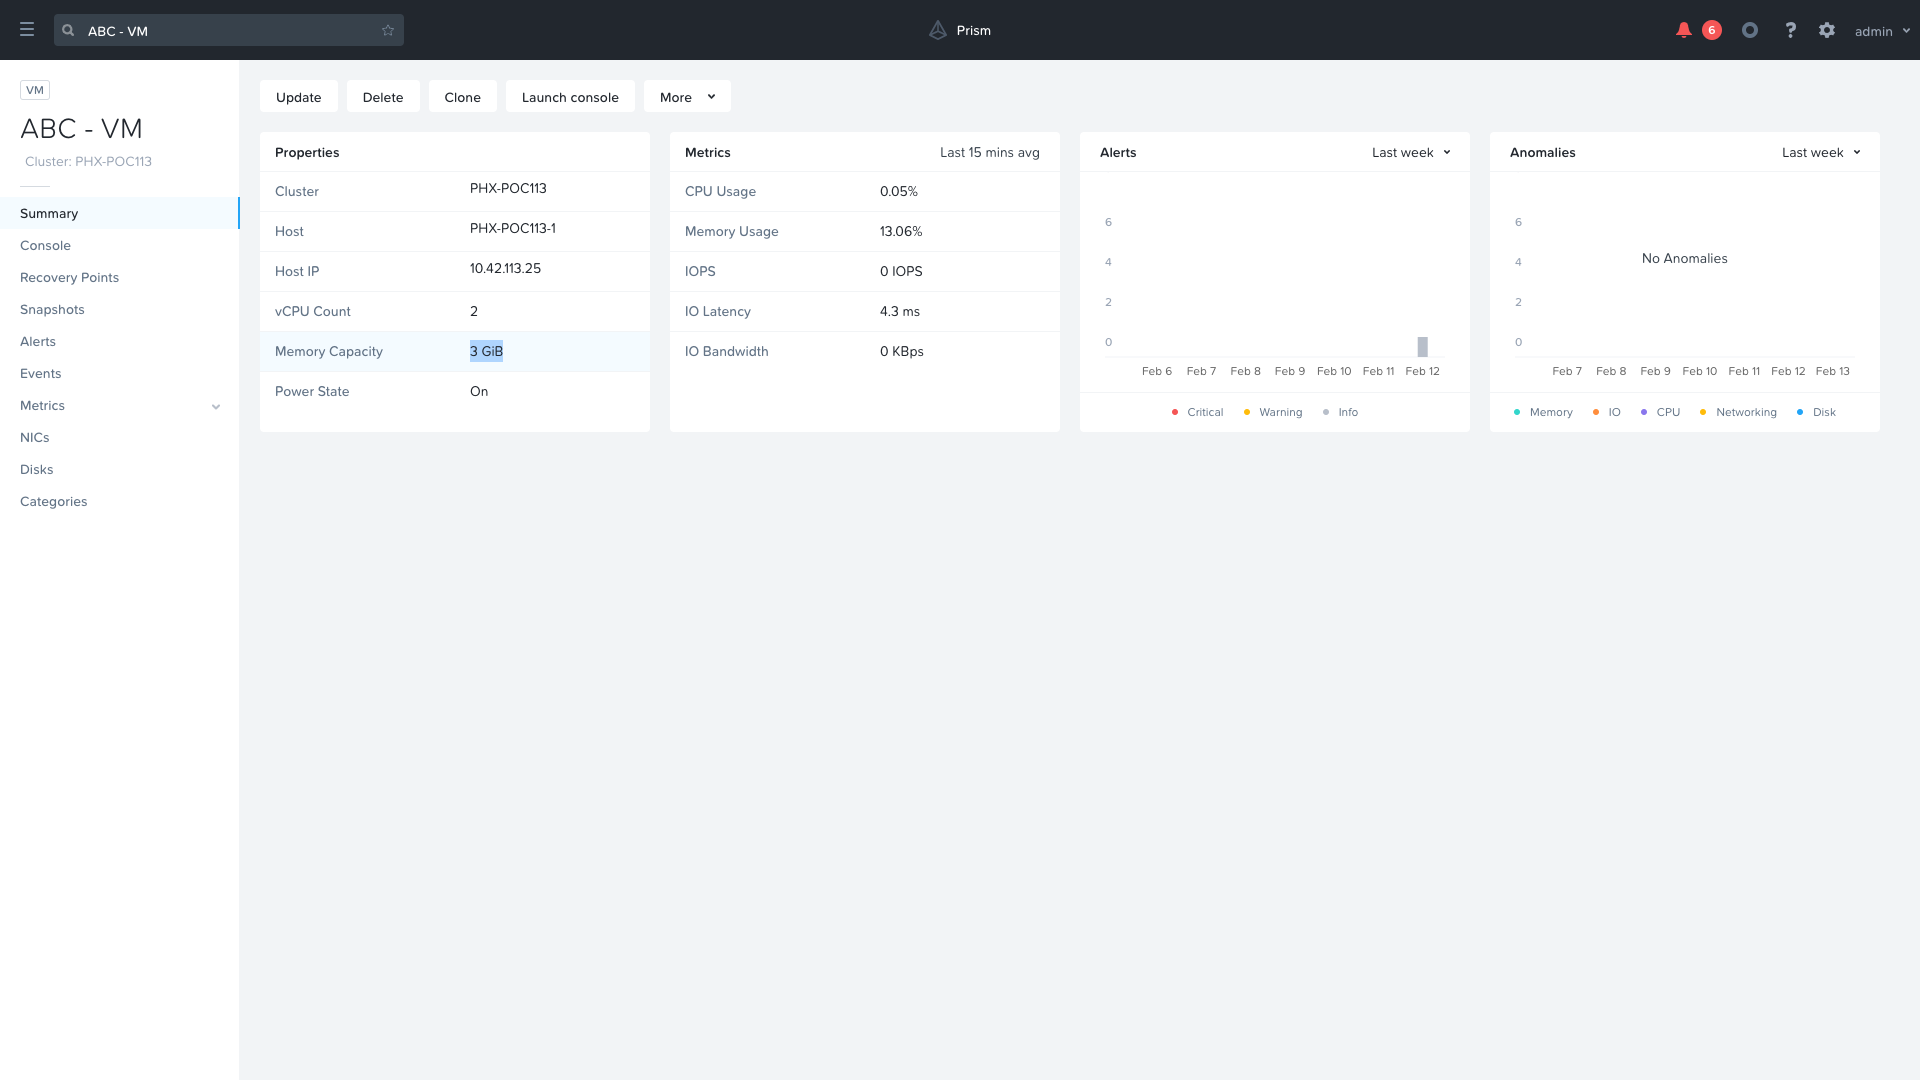
Navigate to your `Initials`-LinuxToolsVM. The examples will use a VM called ABC - VM.
Note the current Memory Capacity of the VM, as we will later increase it with X-Play. You may need to scroll down within the Properties widget to find this value.
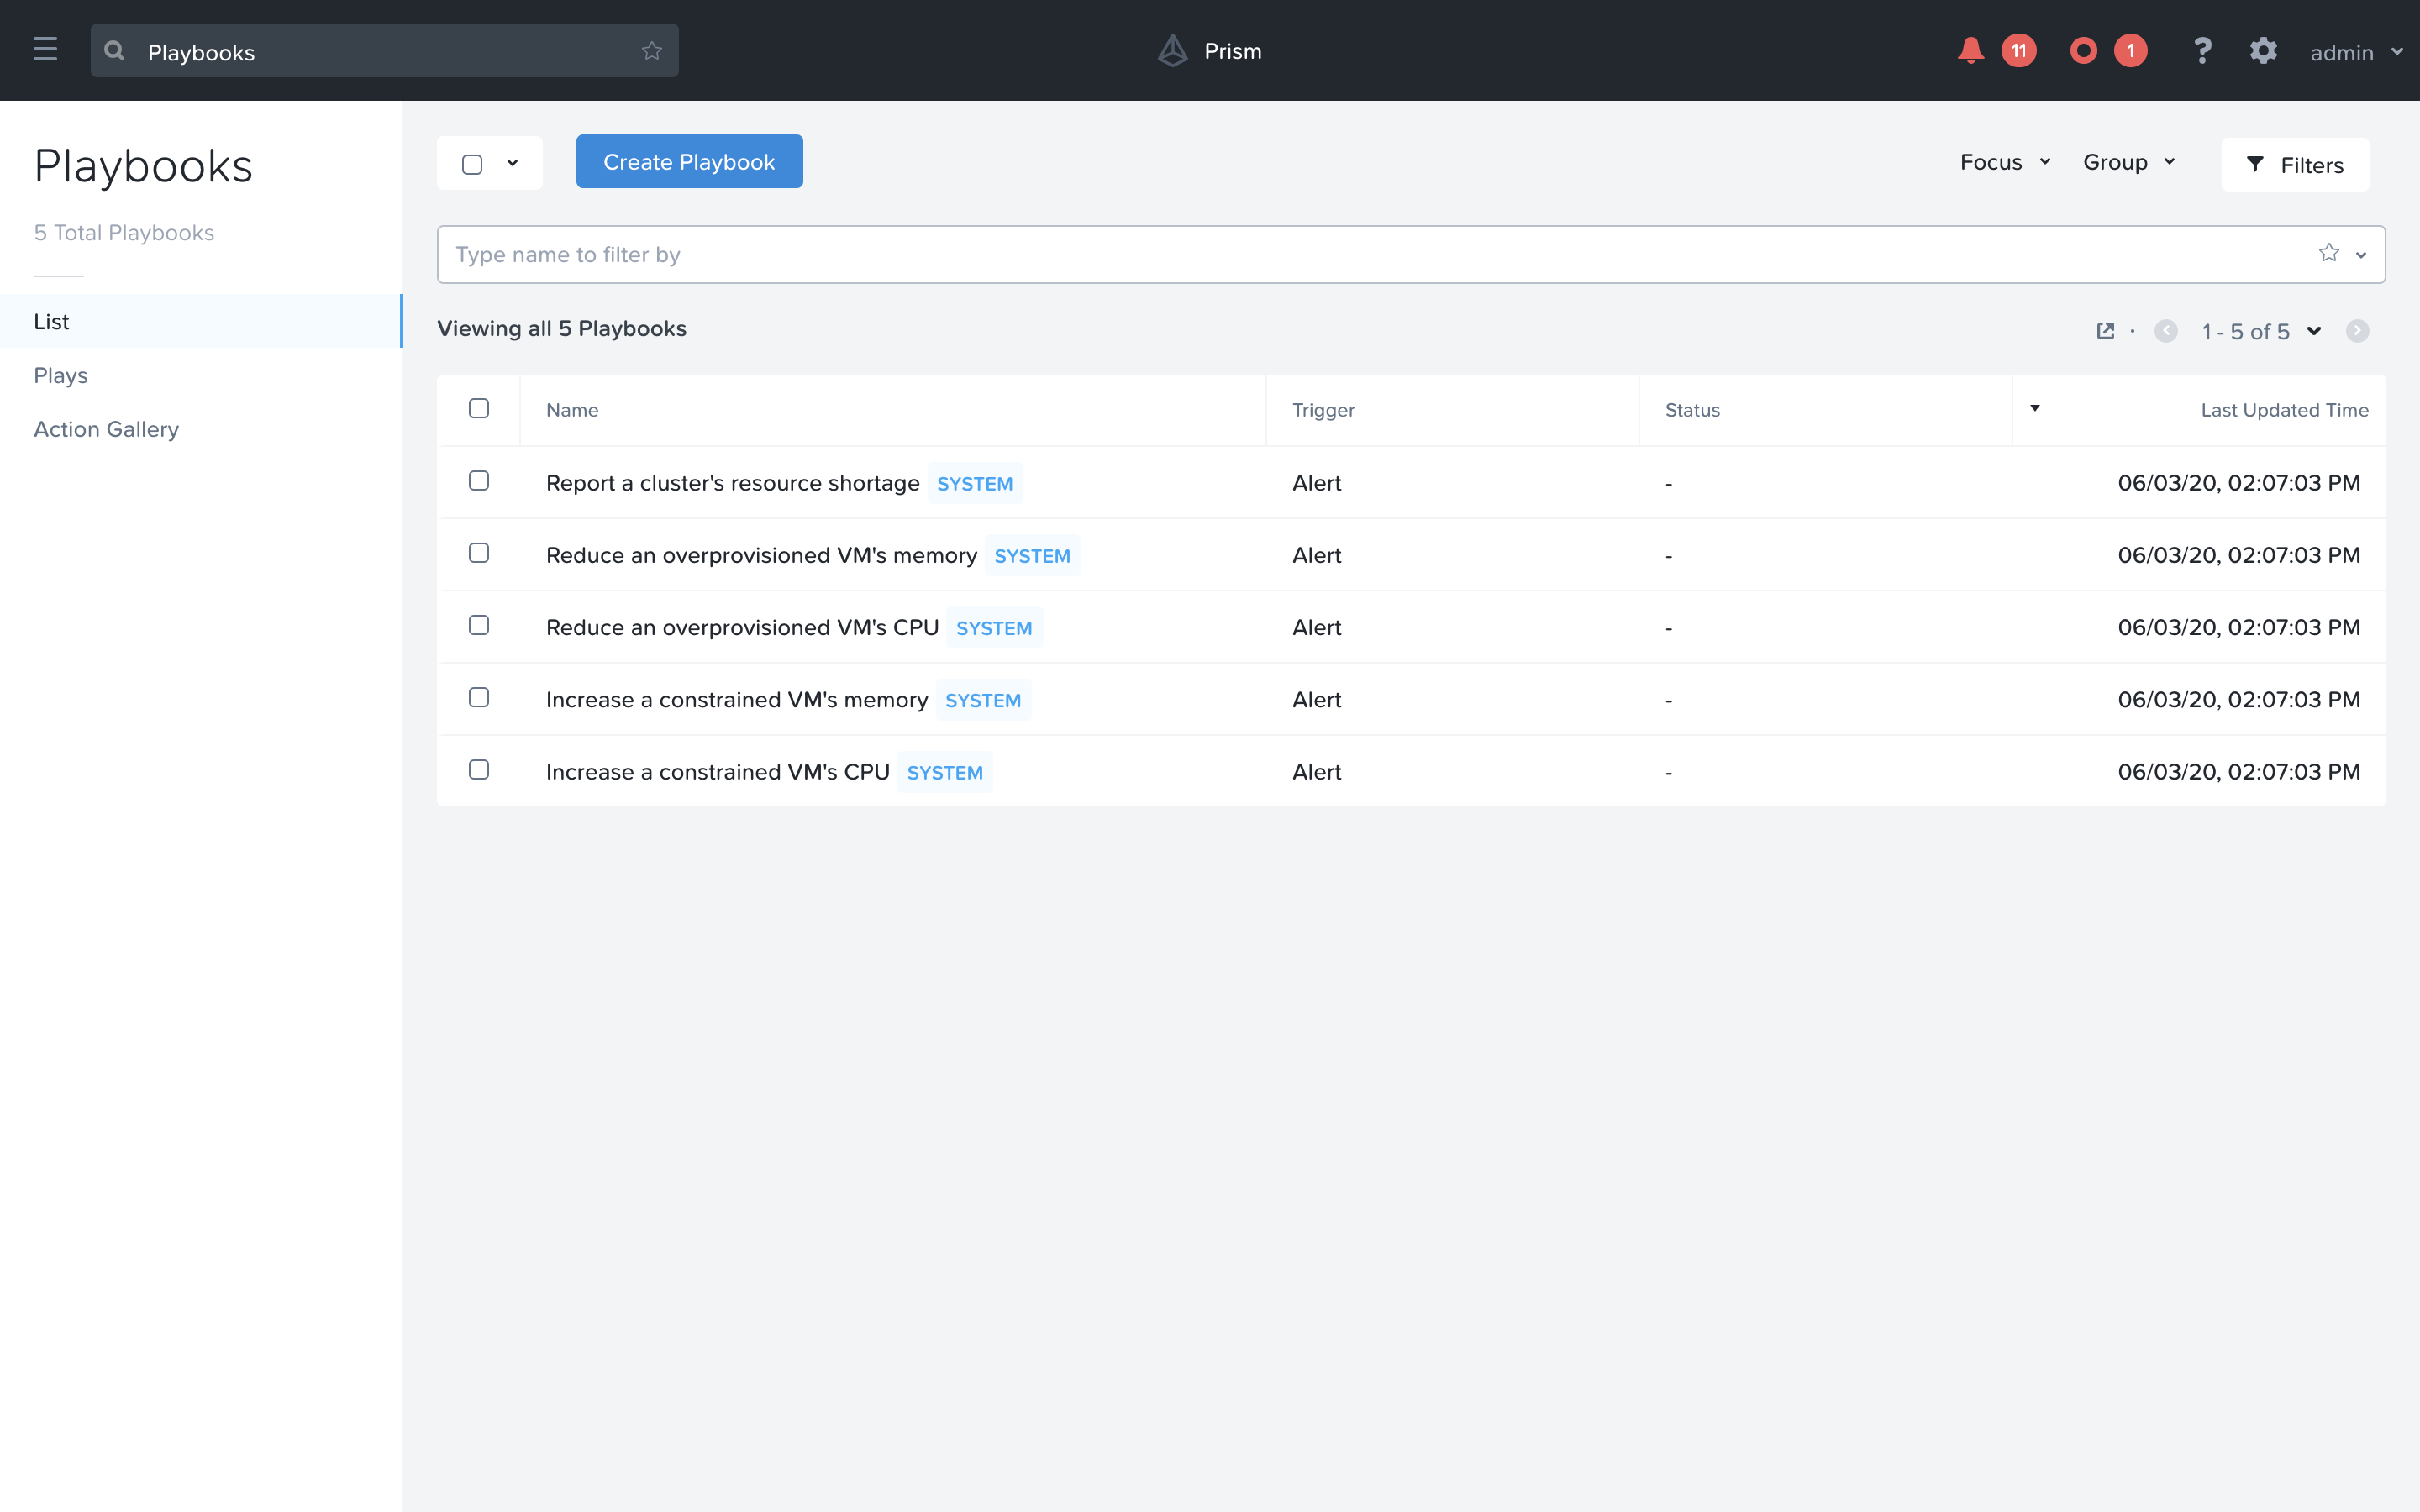
Using the hamburger menu, navigate to Operations > Playbooks.
We will need to create a couple Playbooks for this workflow to be possible. Let’s start by clicking Create Playbook. We will first be creating the Playbook that will be increasing the Memory of the VM.
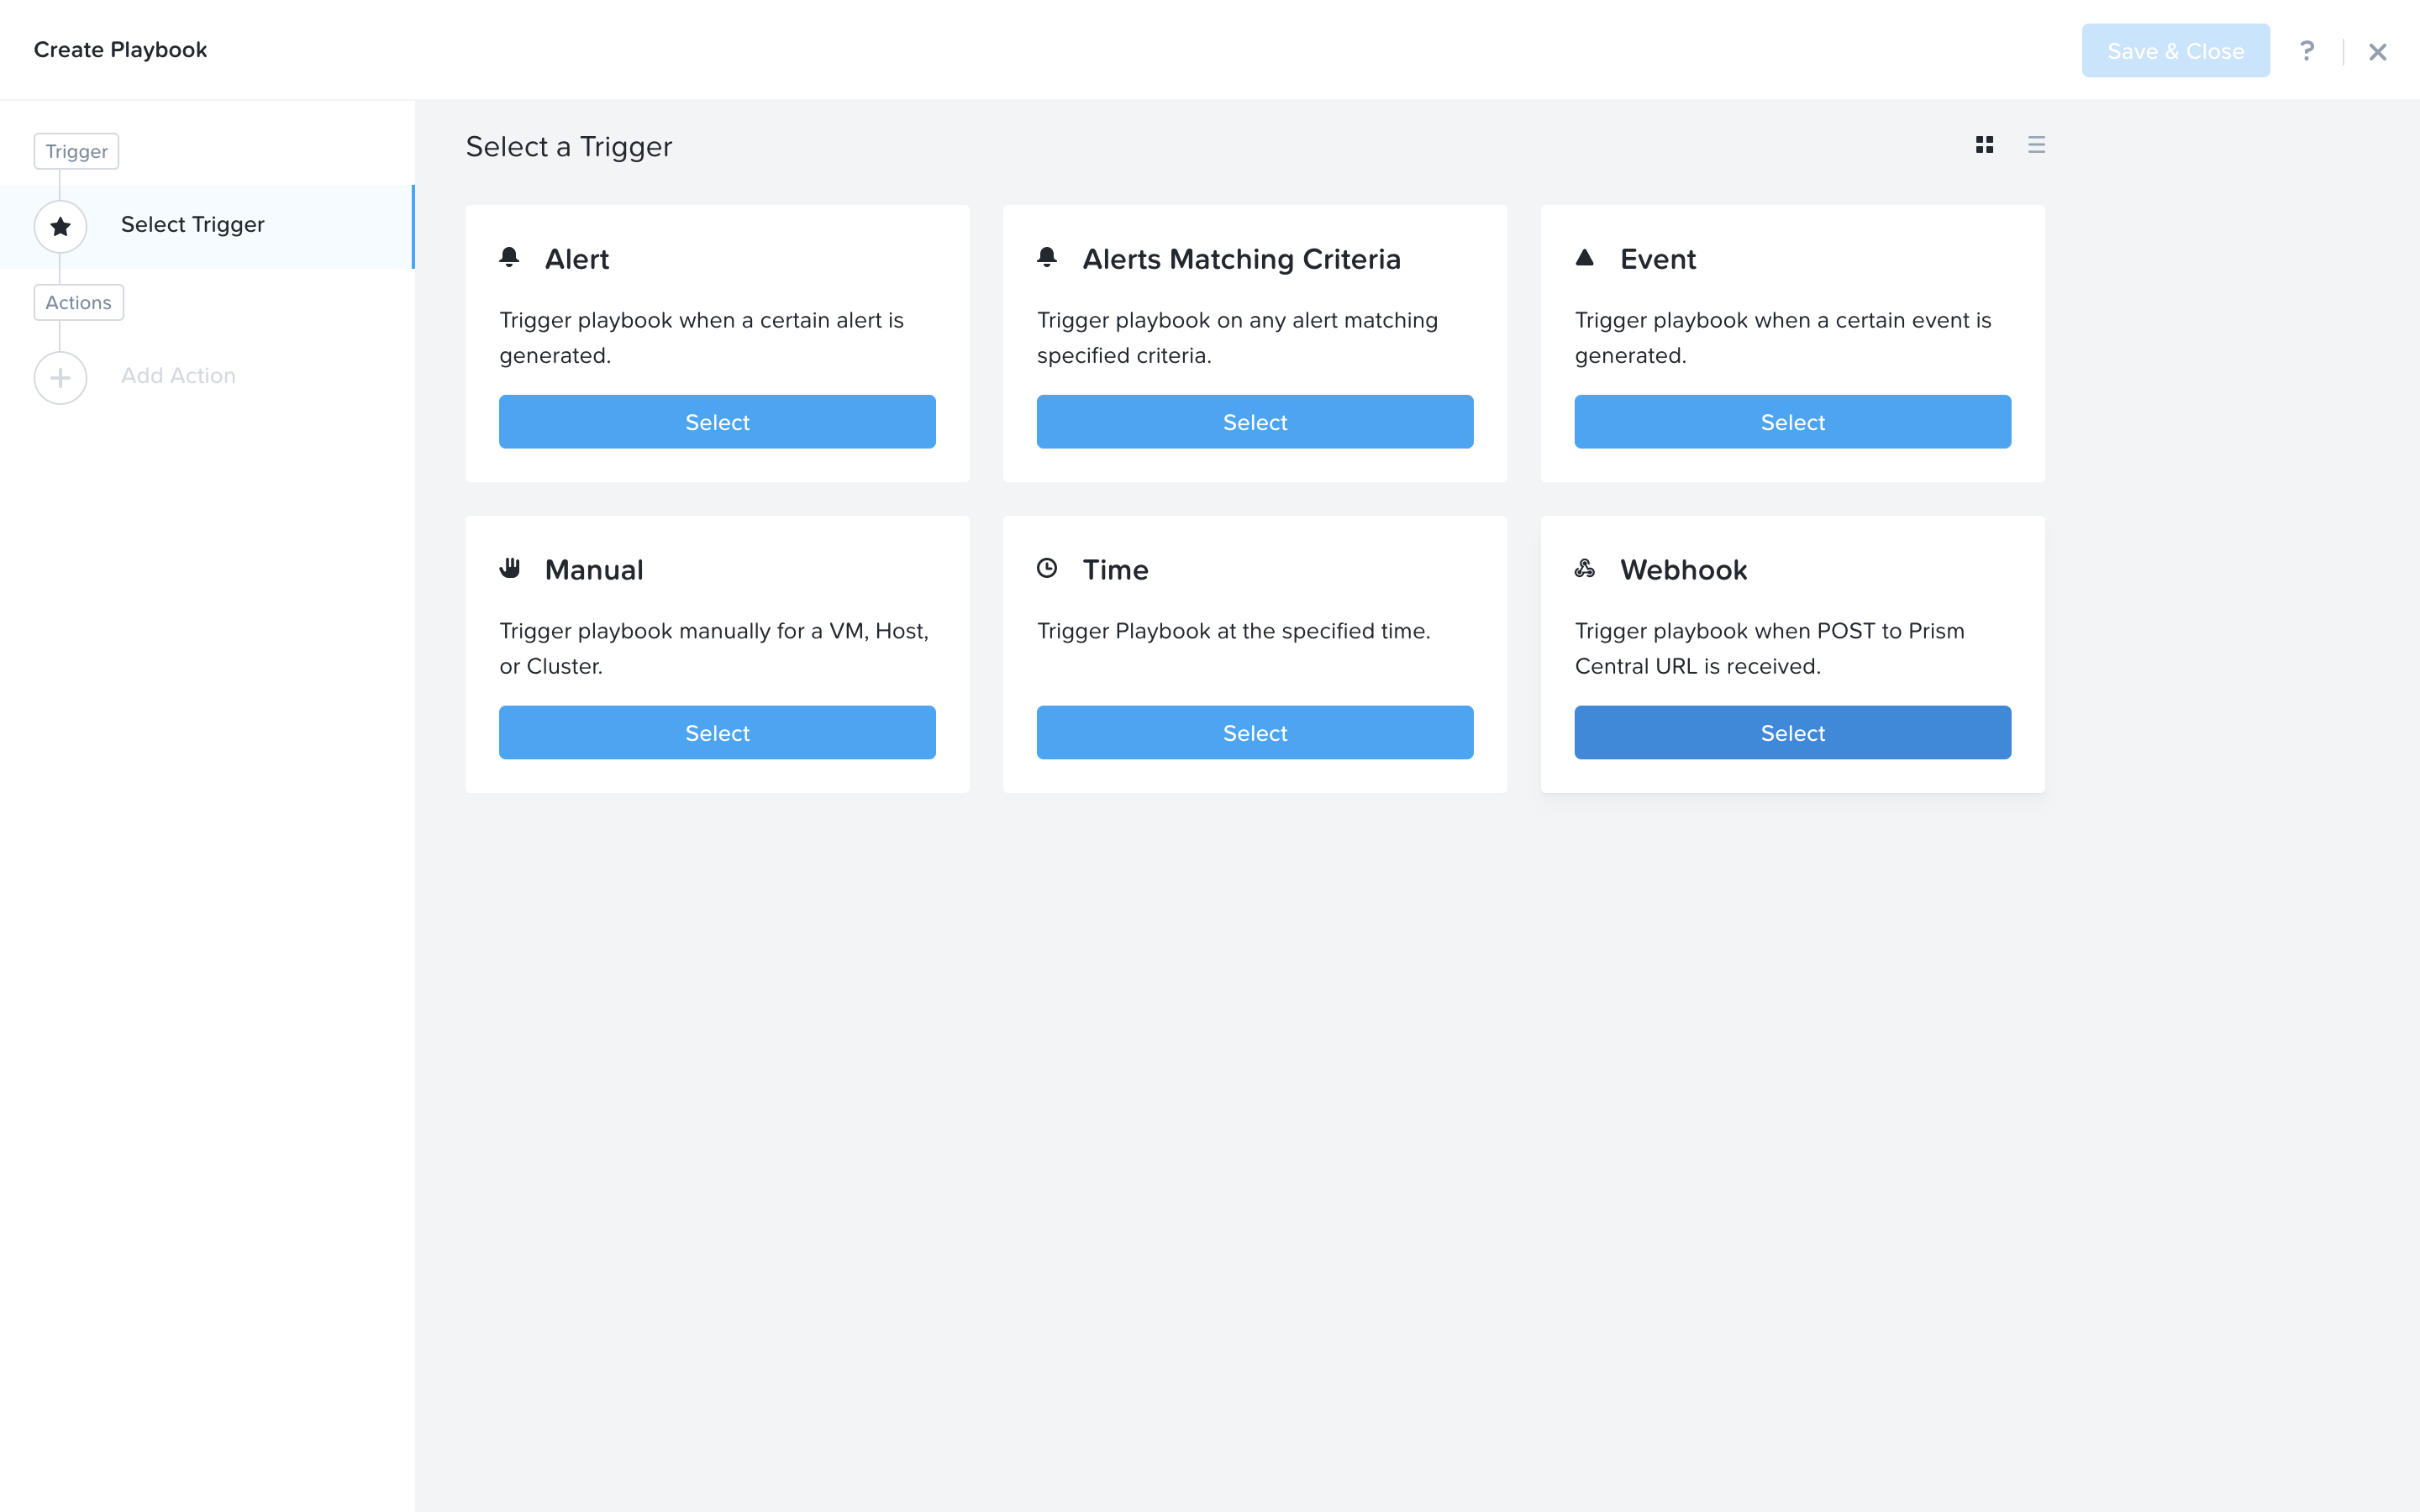
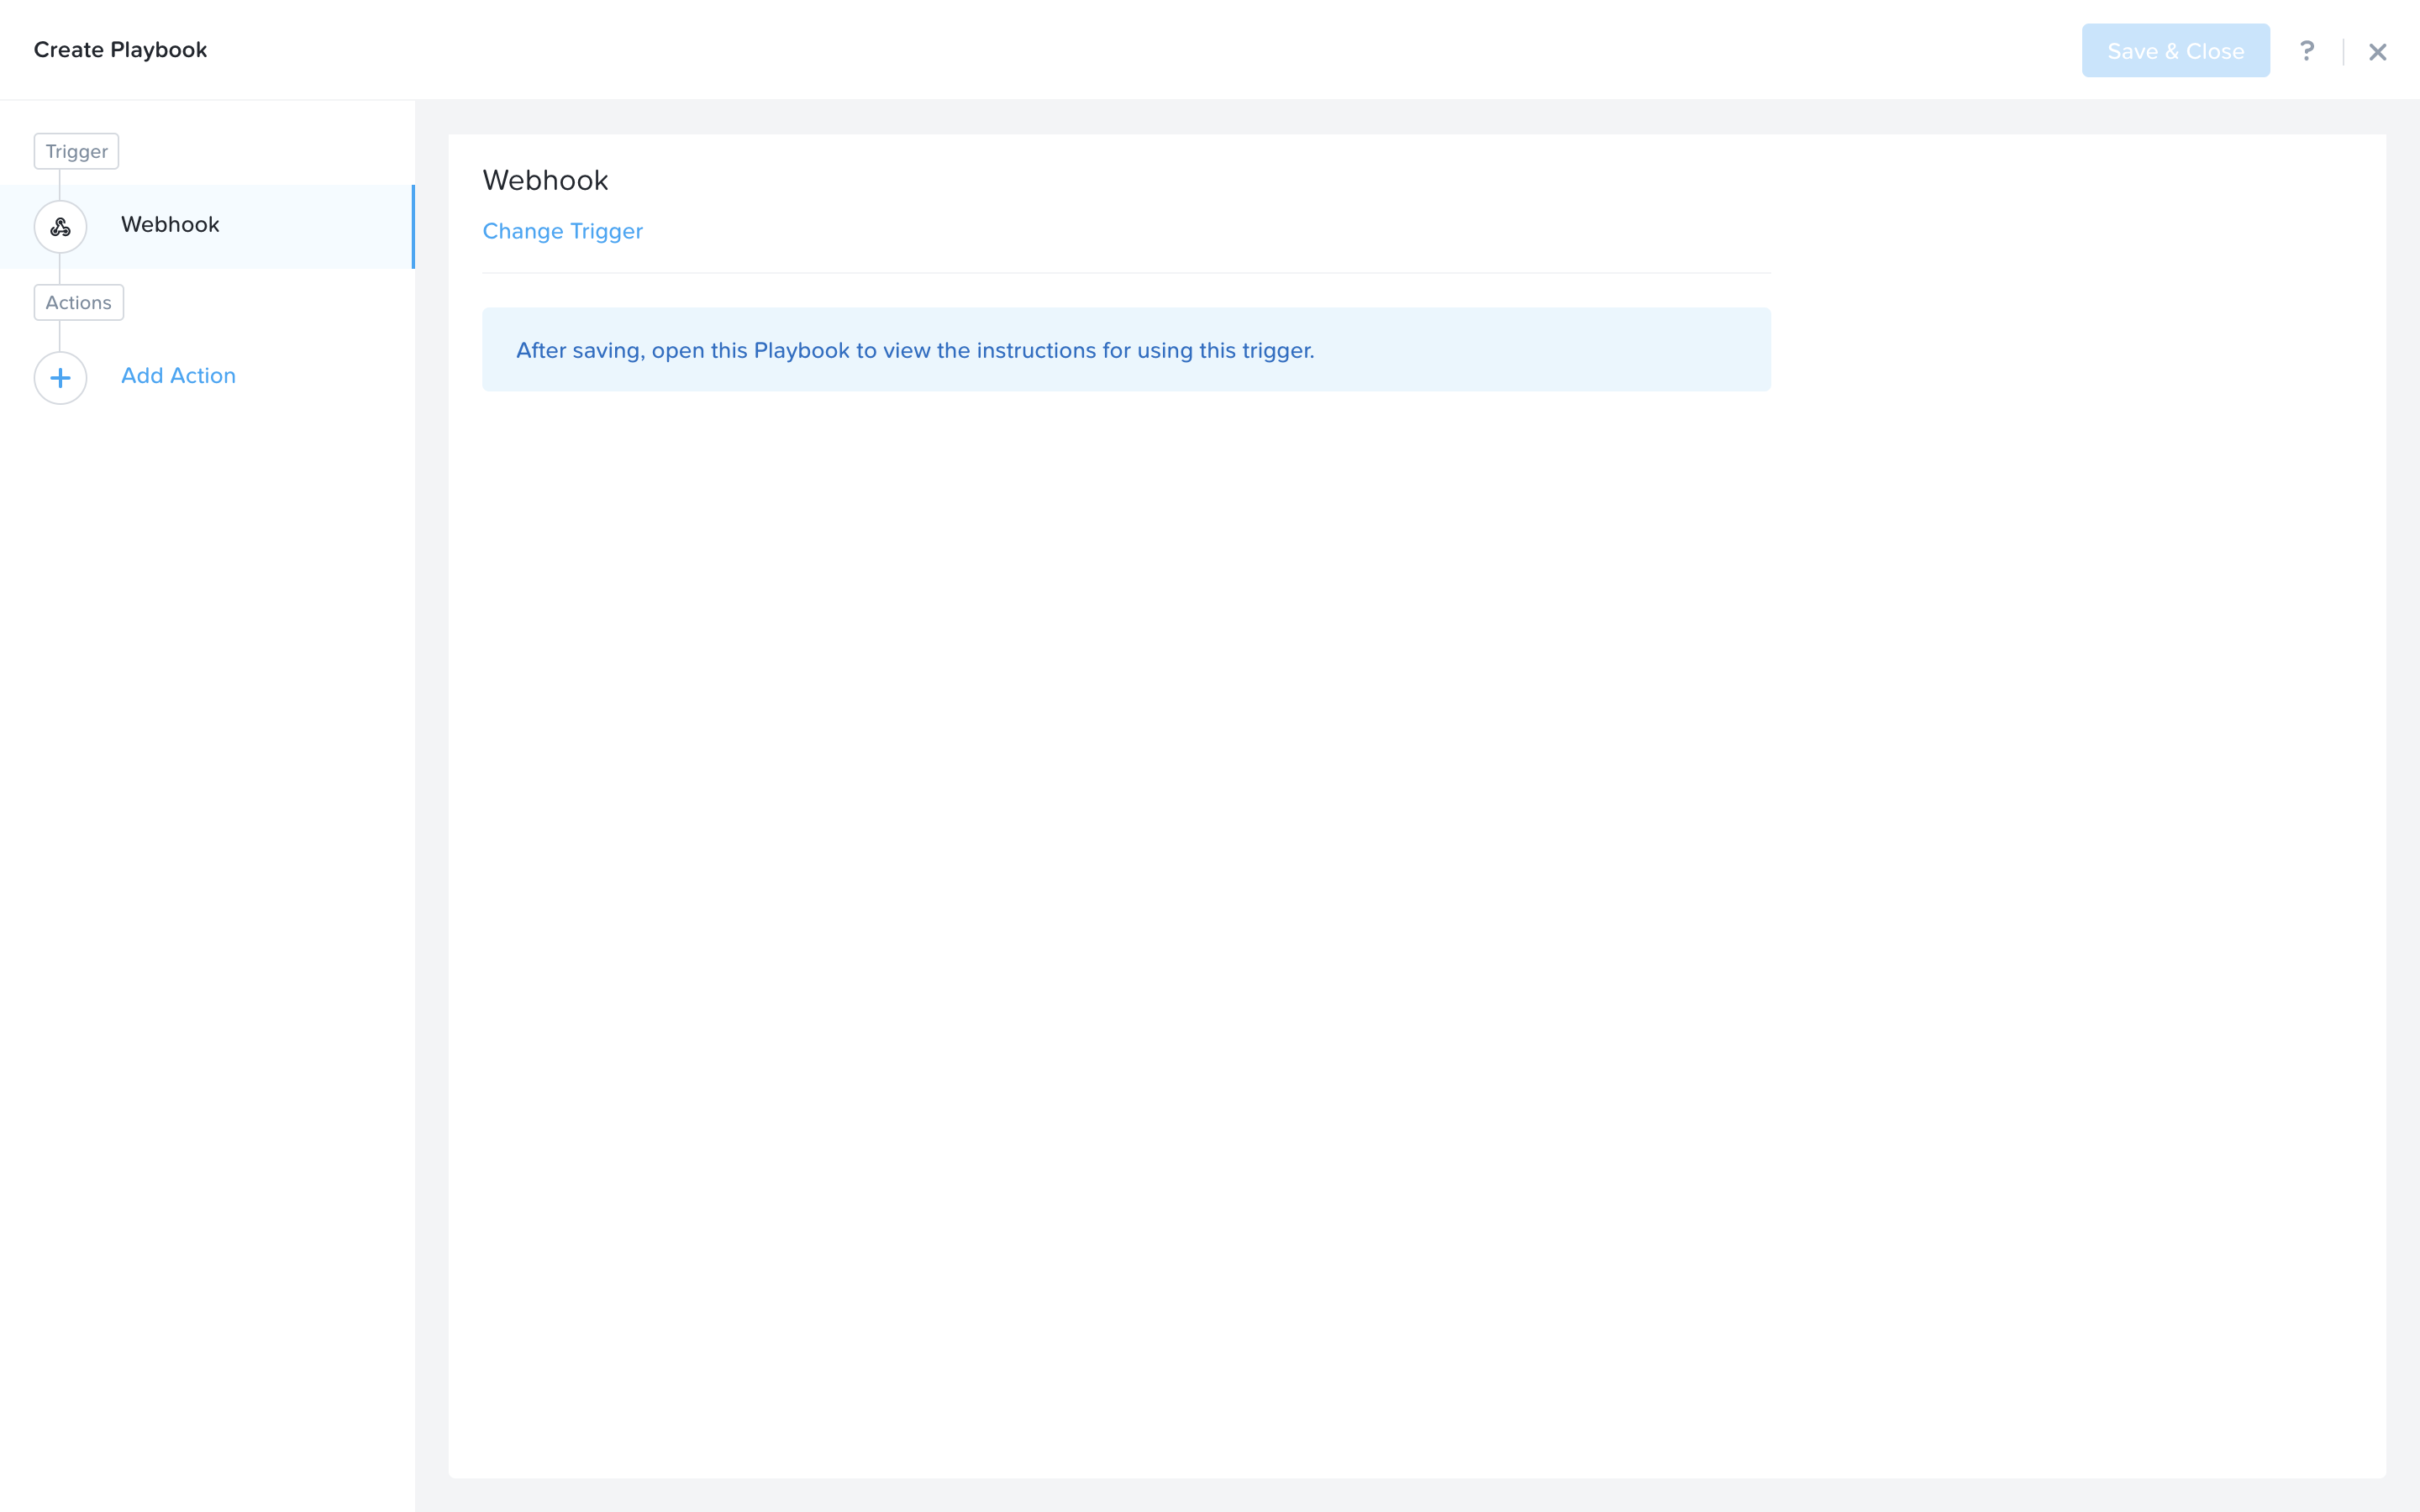
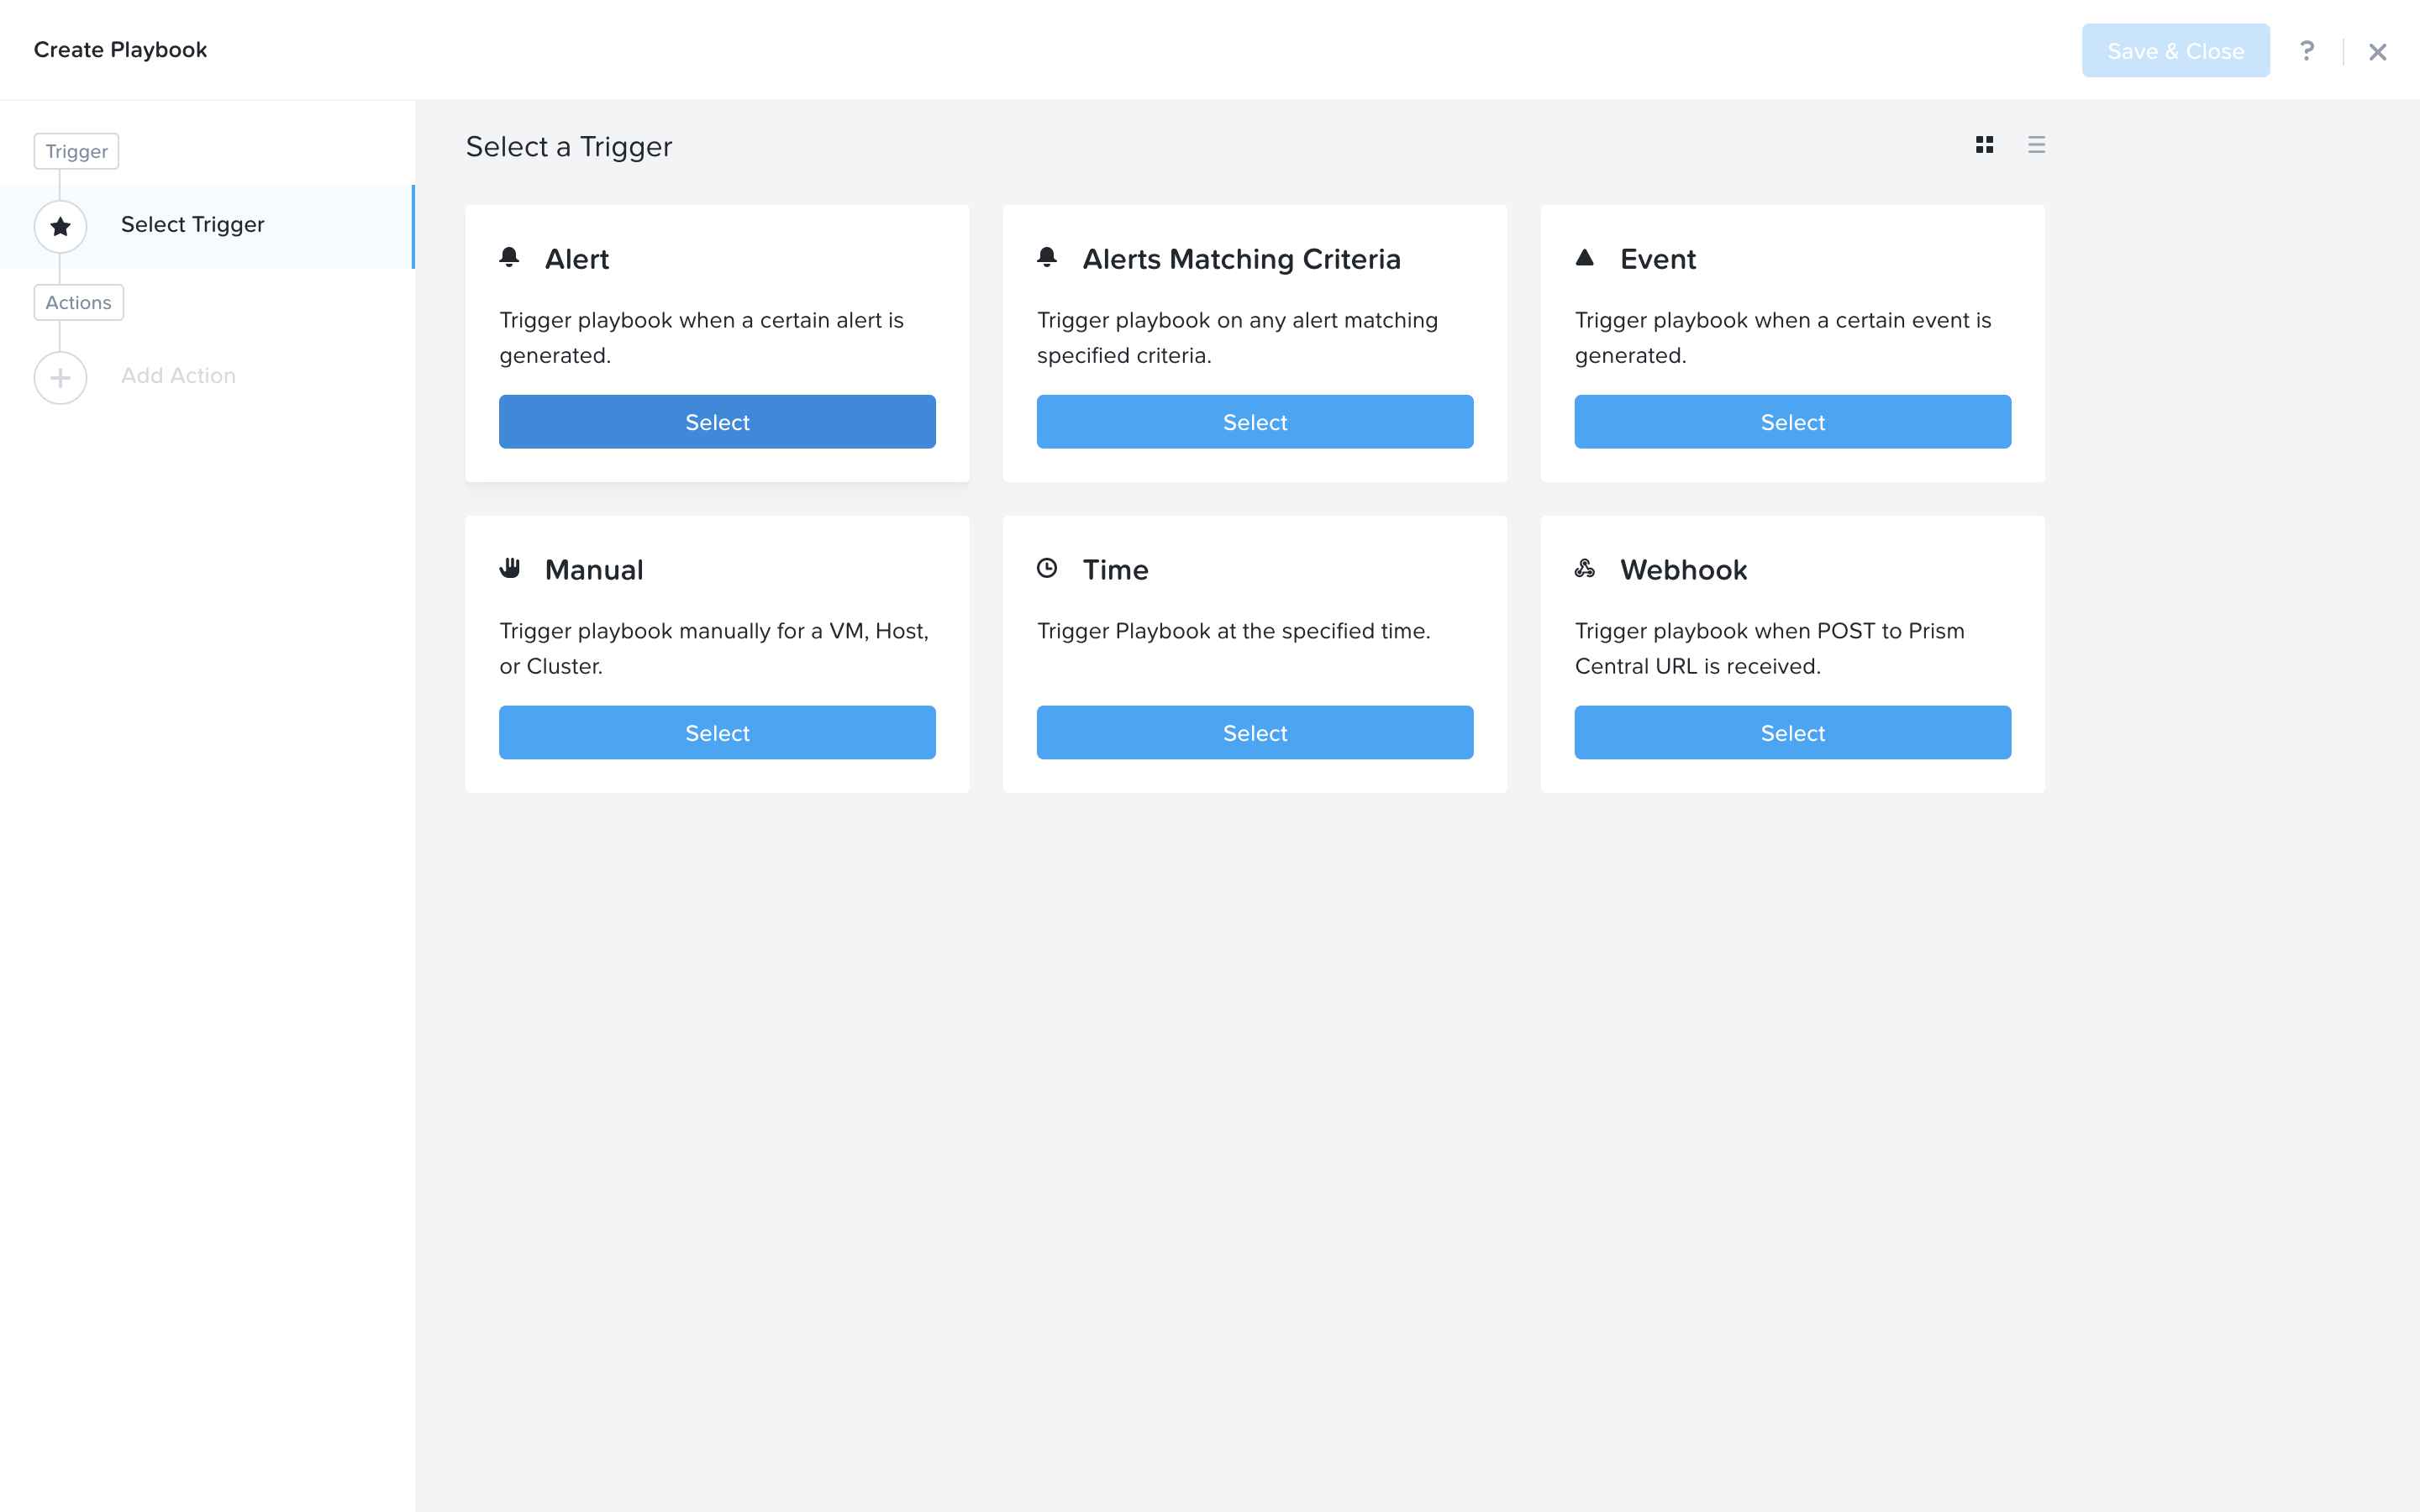
Select Webhook as the trigger. Using this trigger exposes a public API that allows scripts and third party tools such as ServiceNow to use this Webhook to call back into Prism Central and trigger this playbook. In our case, this Playbook will be called by the ticket system to initiate the remediation steps.
Click the Add Action item on the left side.
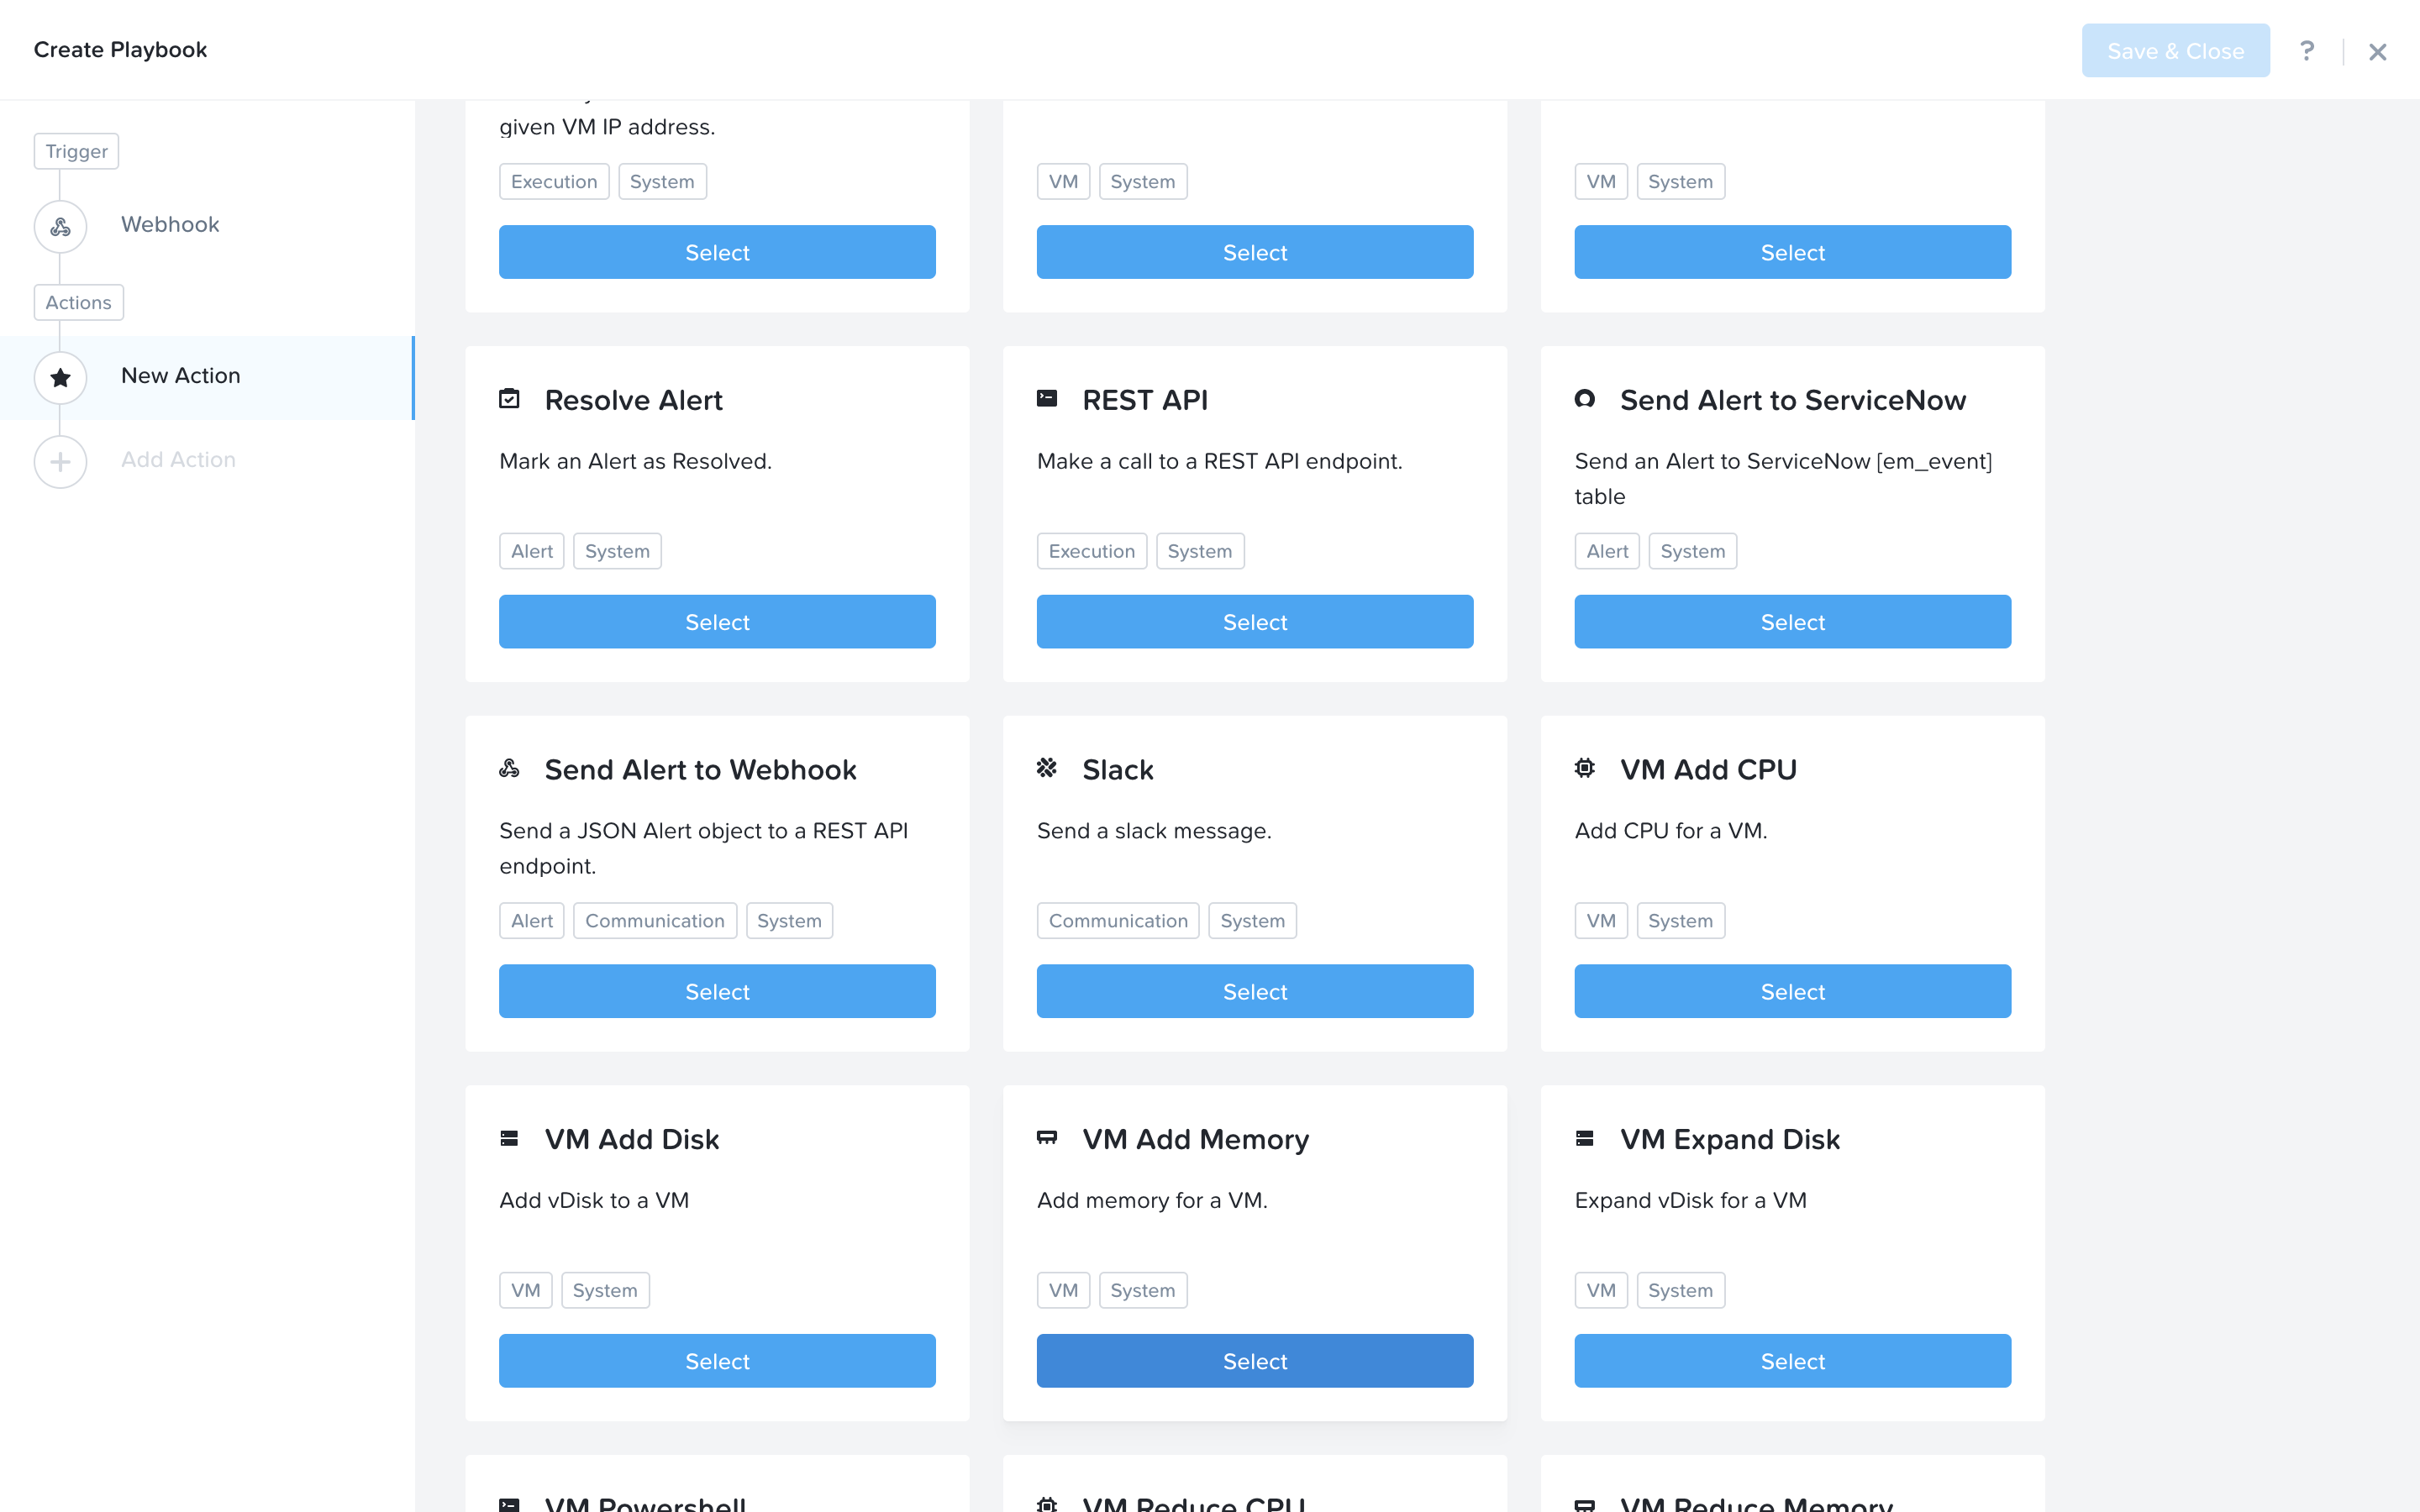
Next we would like to select the VM Add Memory action.
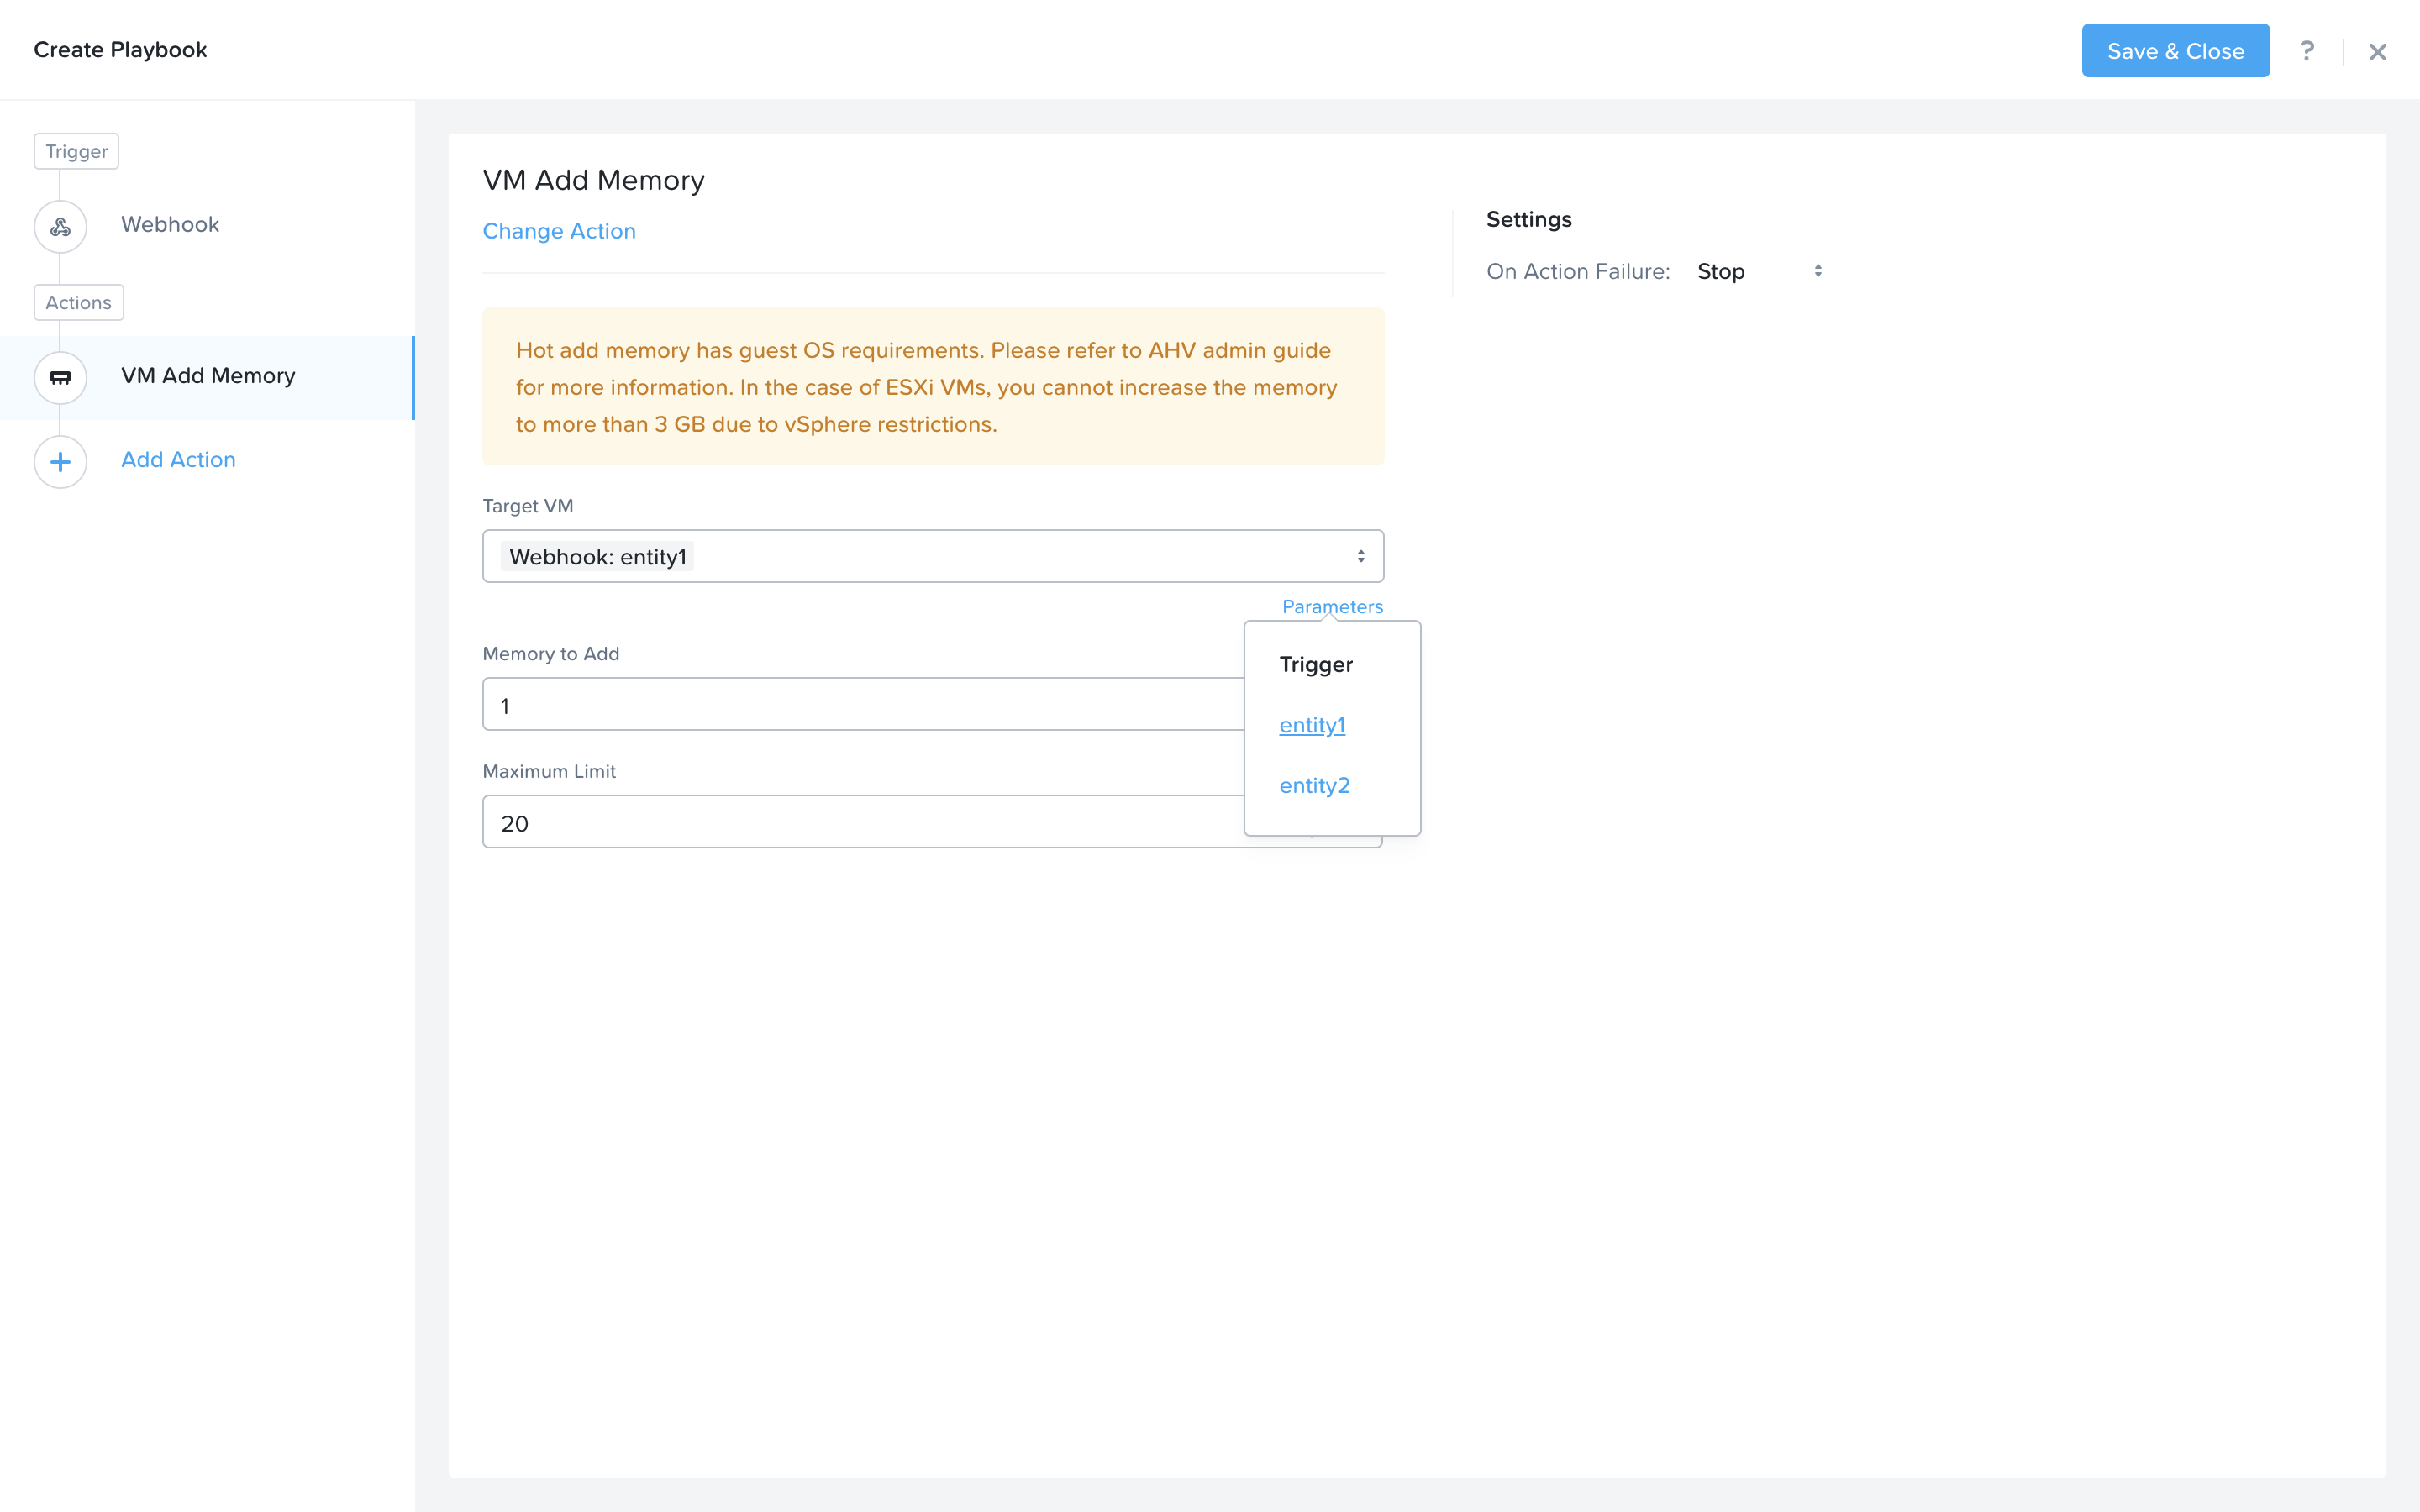
Use the Parameters link to fill in the entity1 parameter which is exposed from the Webhook trigger. The caller will pass in the VM to act on as entity1. Set the remainder of the fields according to the screen below. Then click Add Action to add the next action.
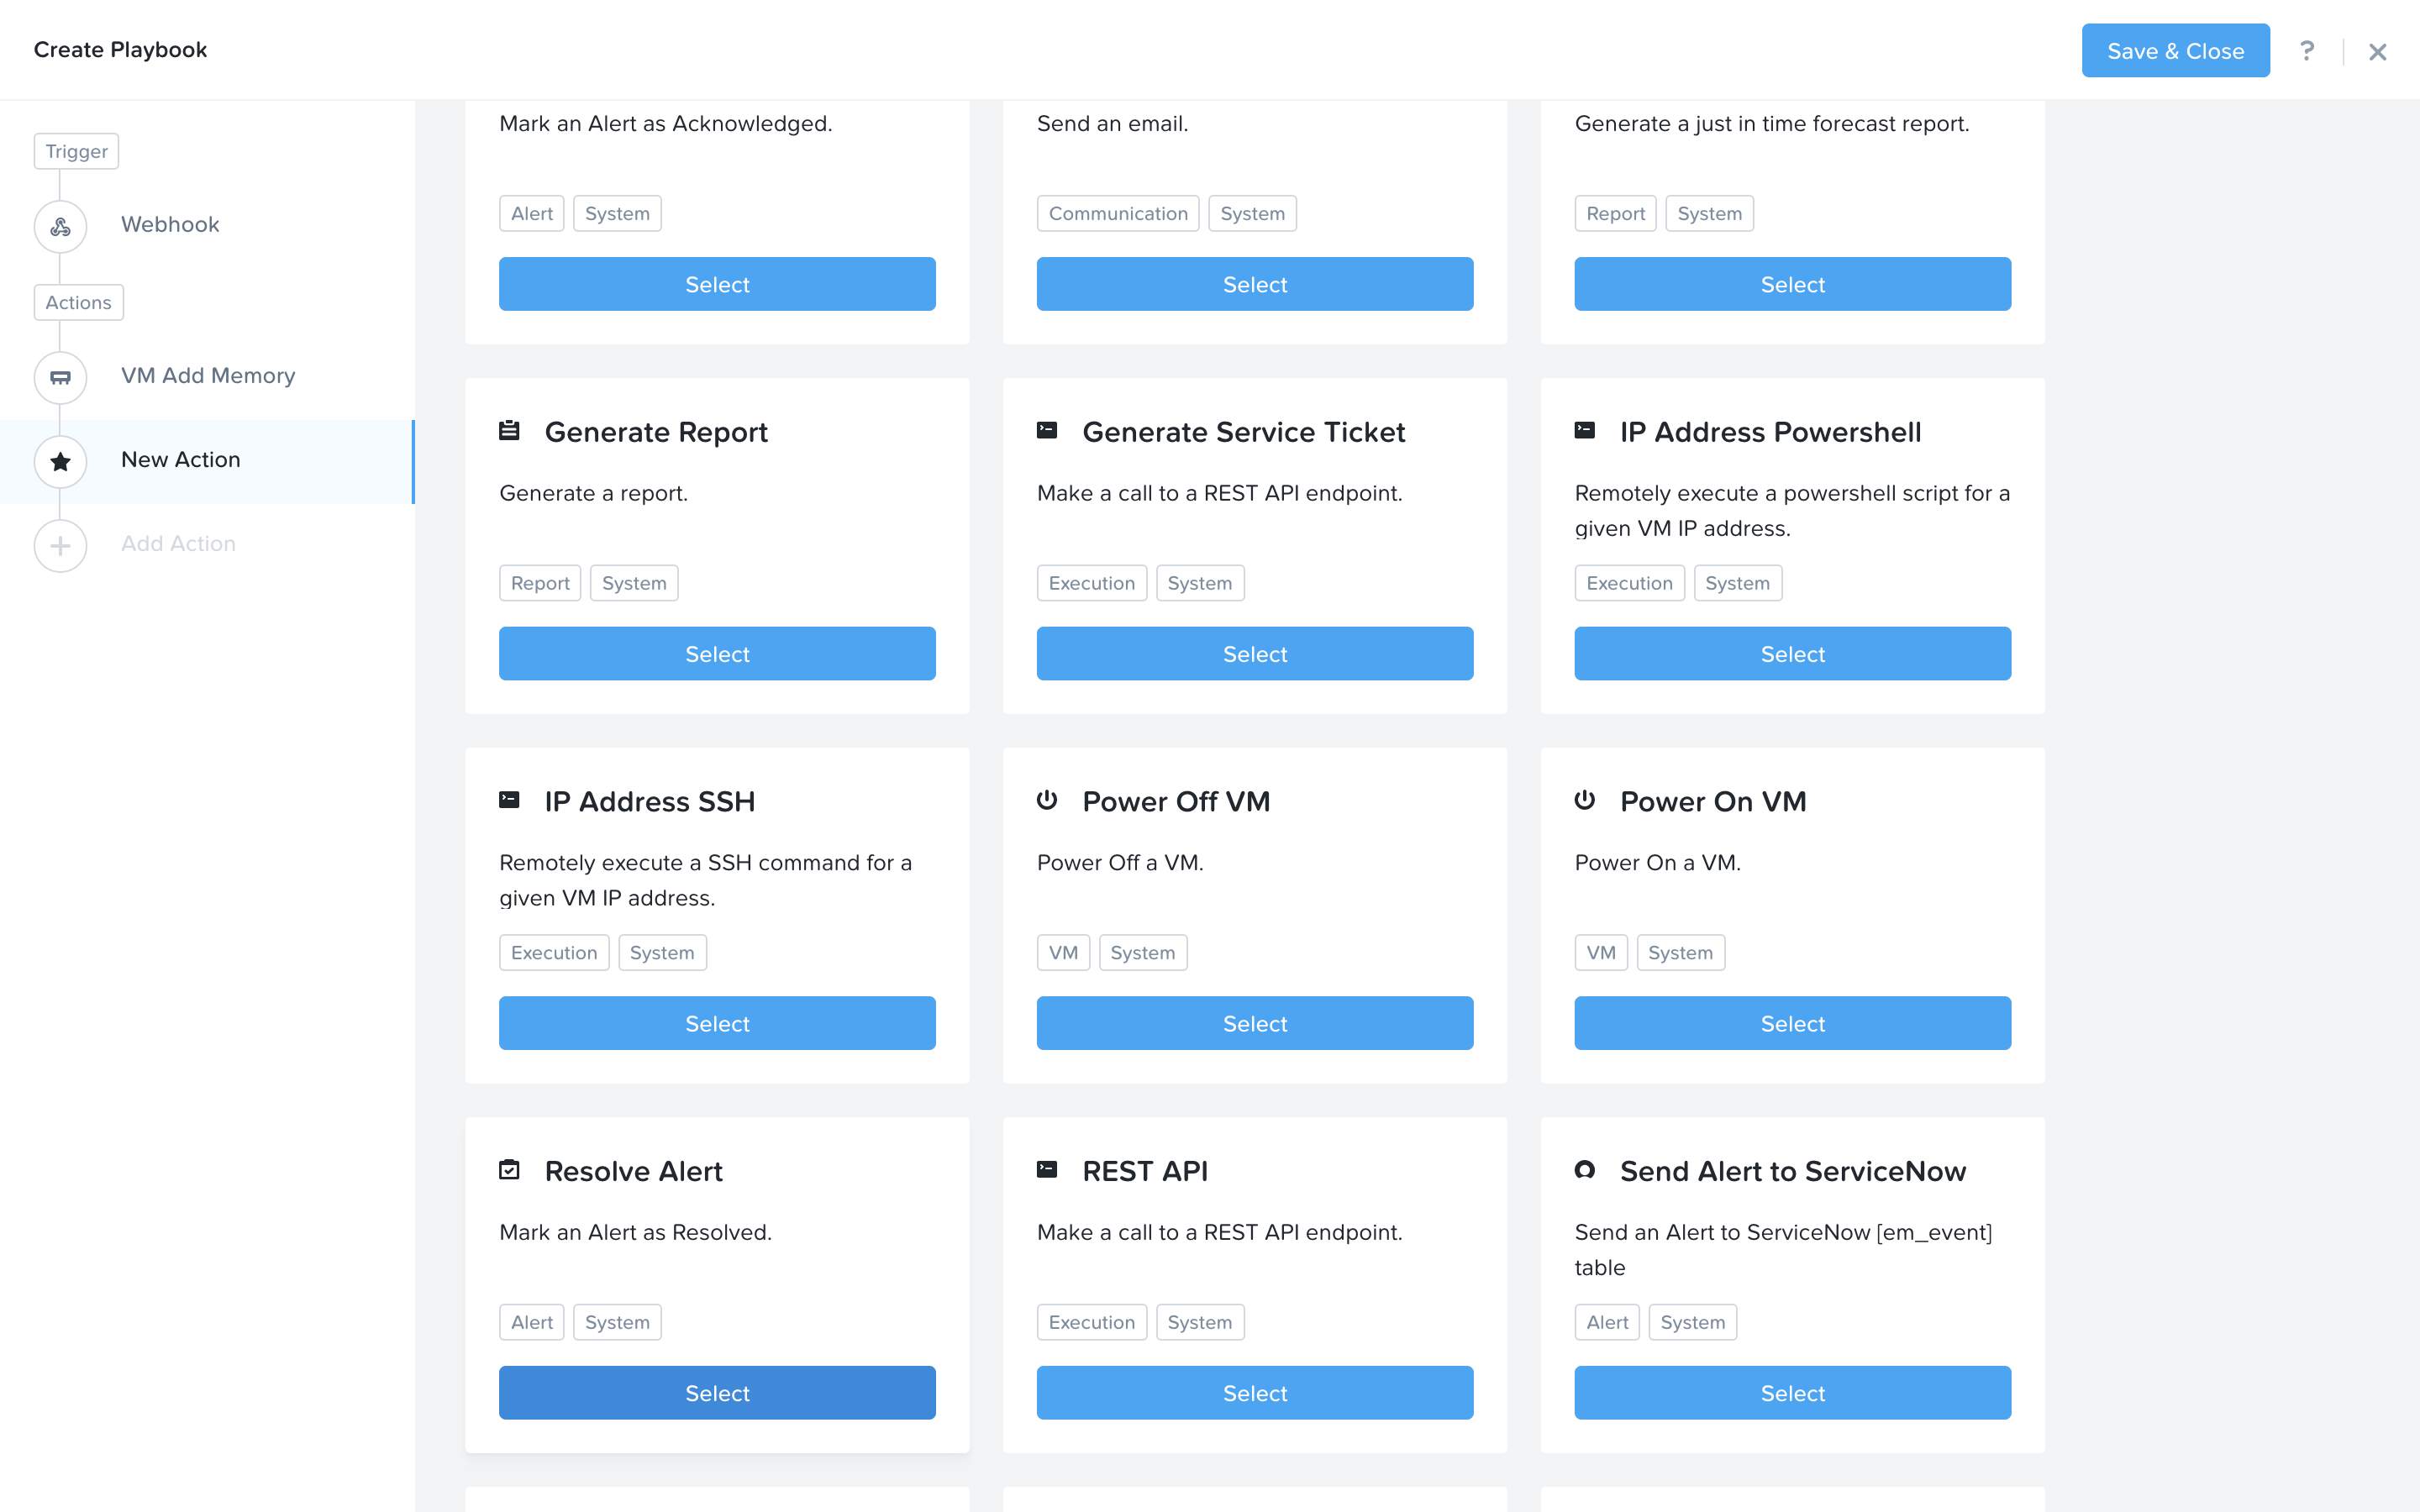
Select the Resolve Alert action.
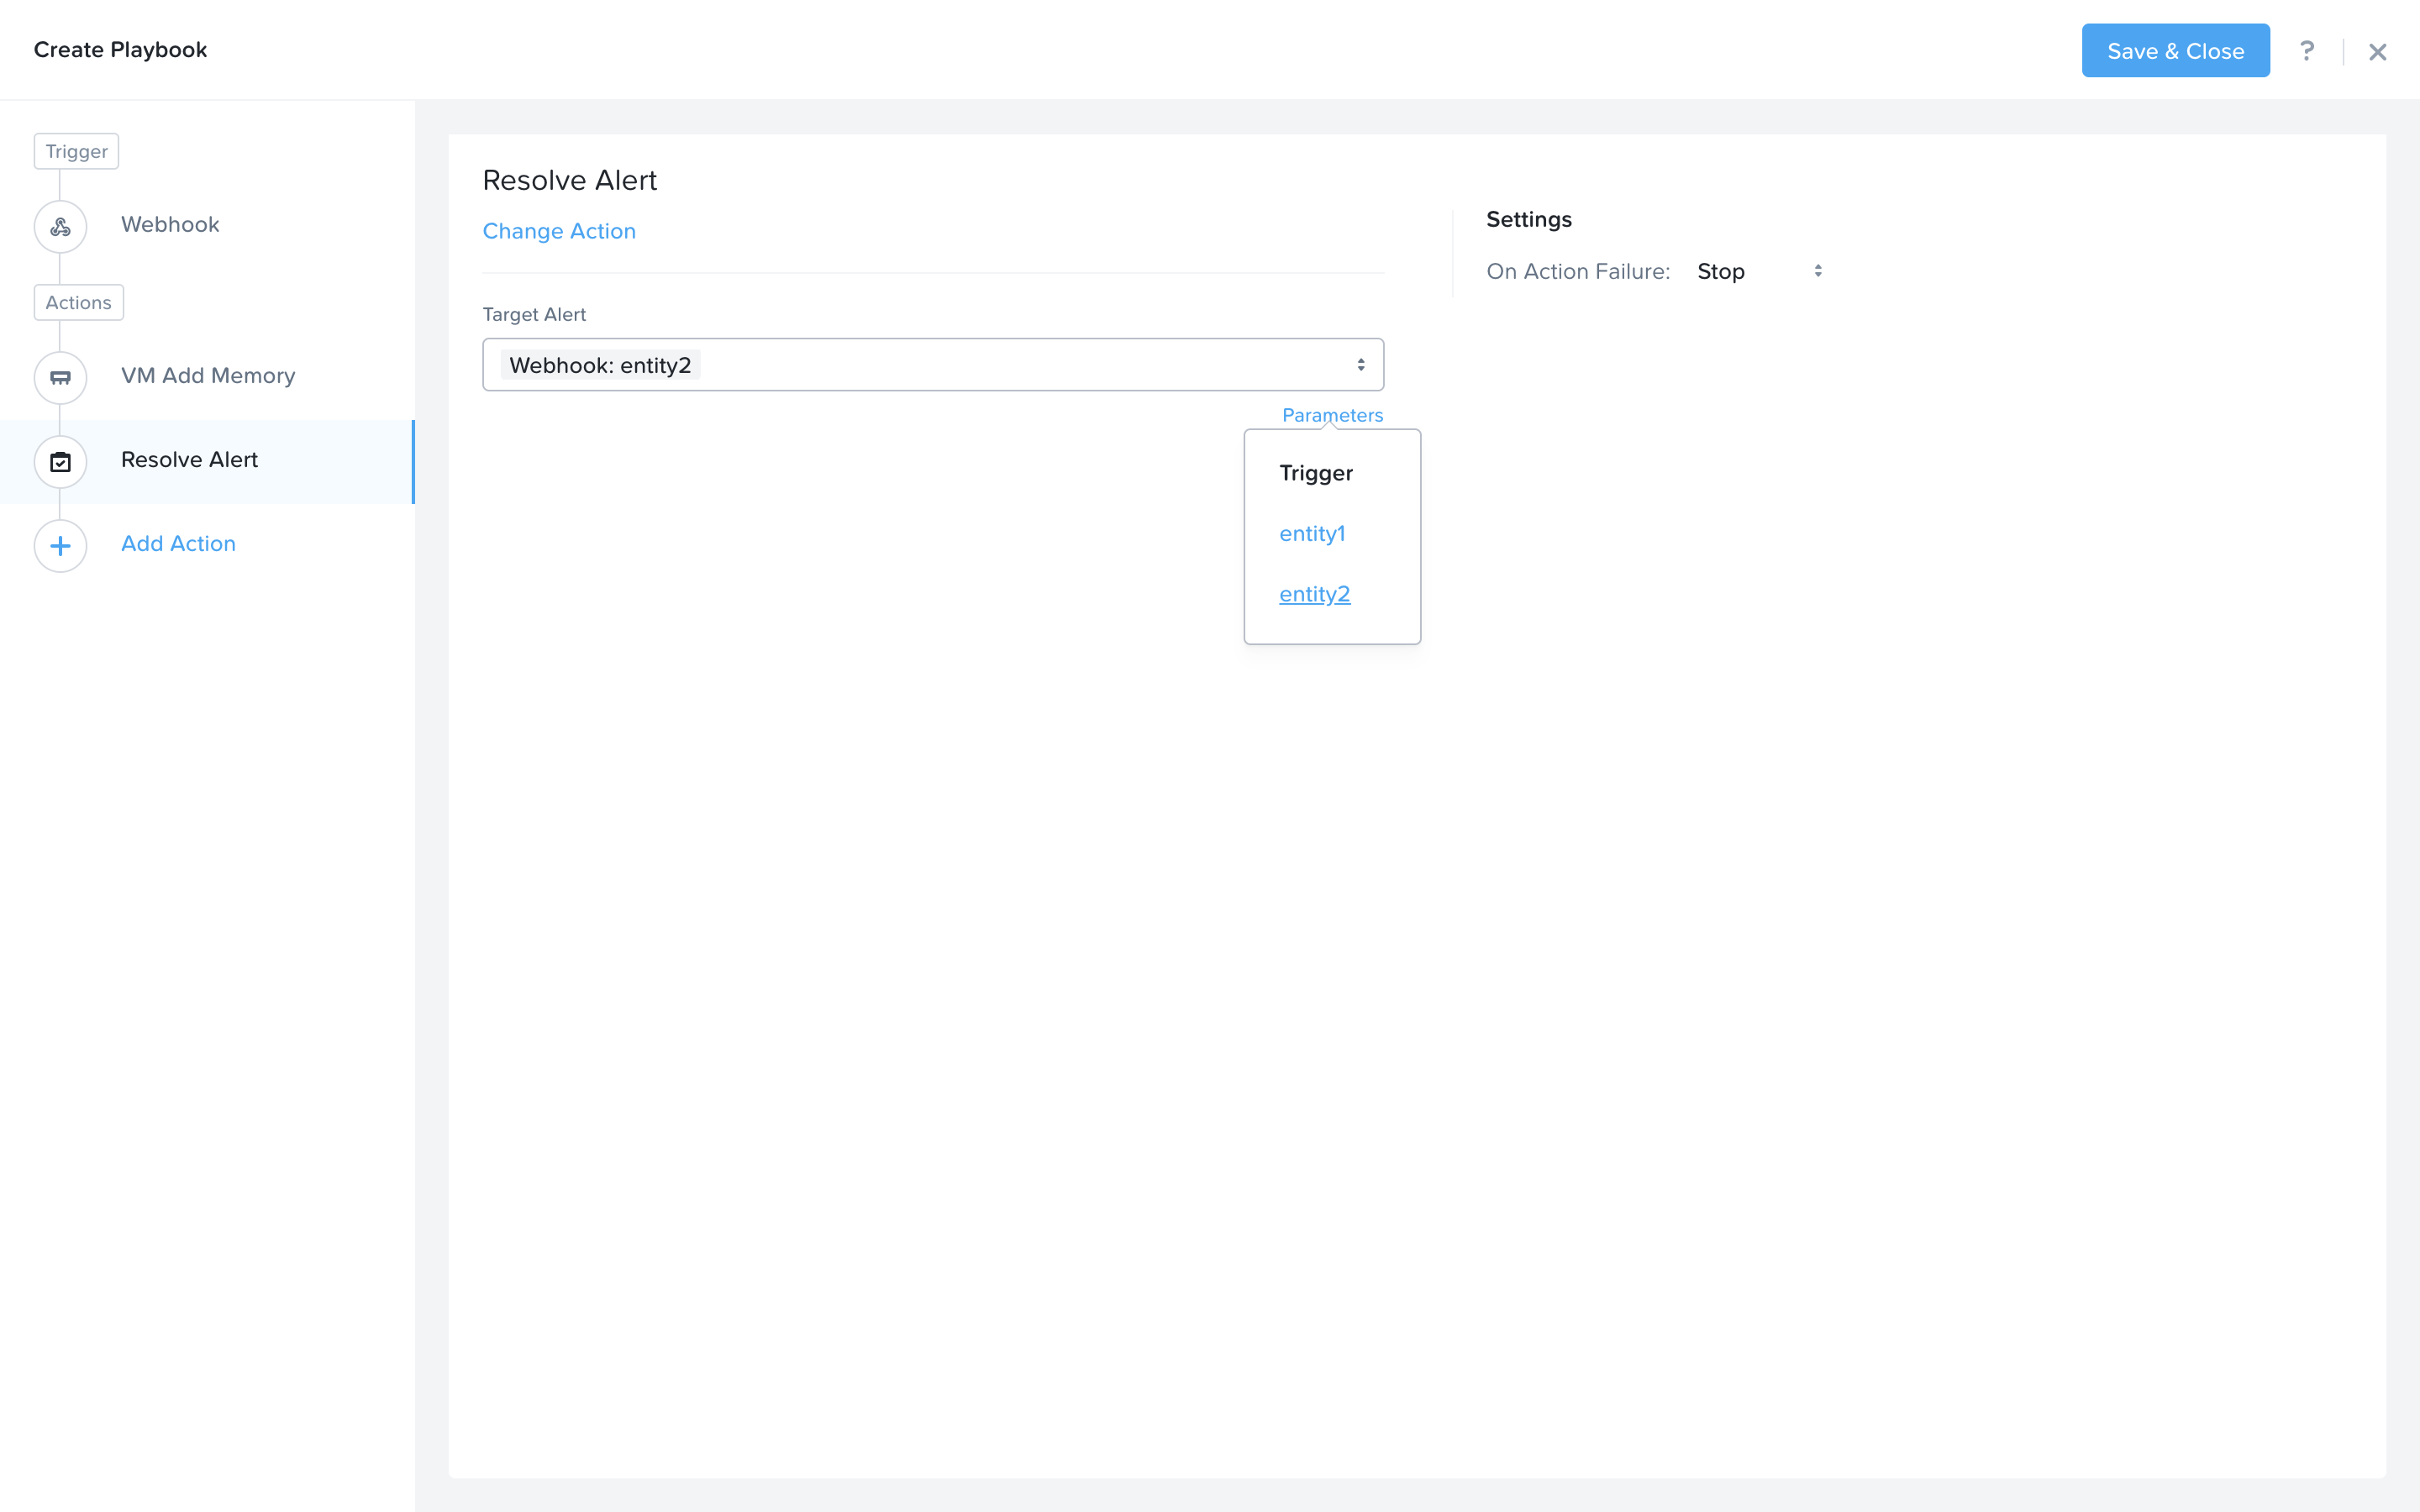
Use the Parameters link to fill in the entity2 parameter which is exposed from the Webhook trigger. The caller will pass the Alert to be resolved as entity2. Then click Add Action and choose the Email action.
Fill in the field in the email action. Here are the examples.
Recipient: - Fill in your email address.
Subject: -
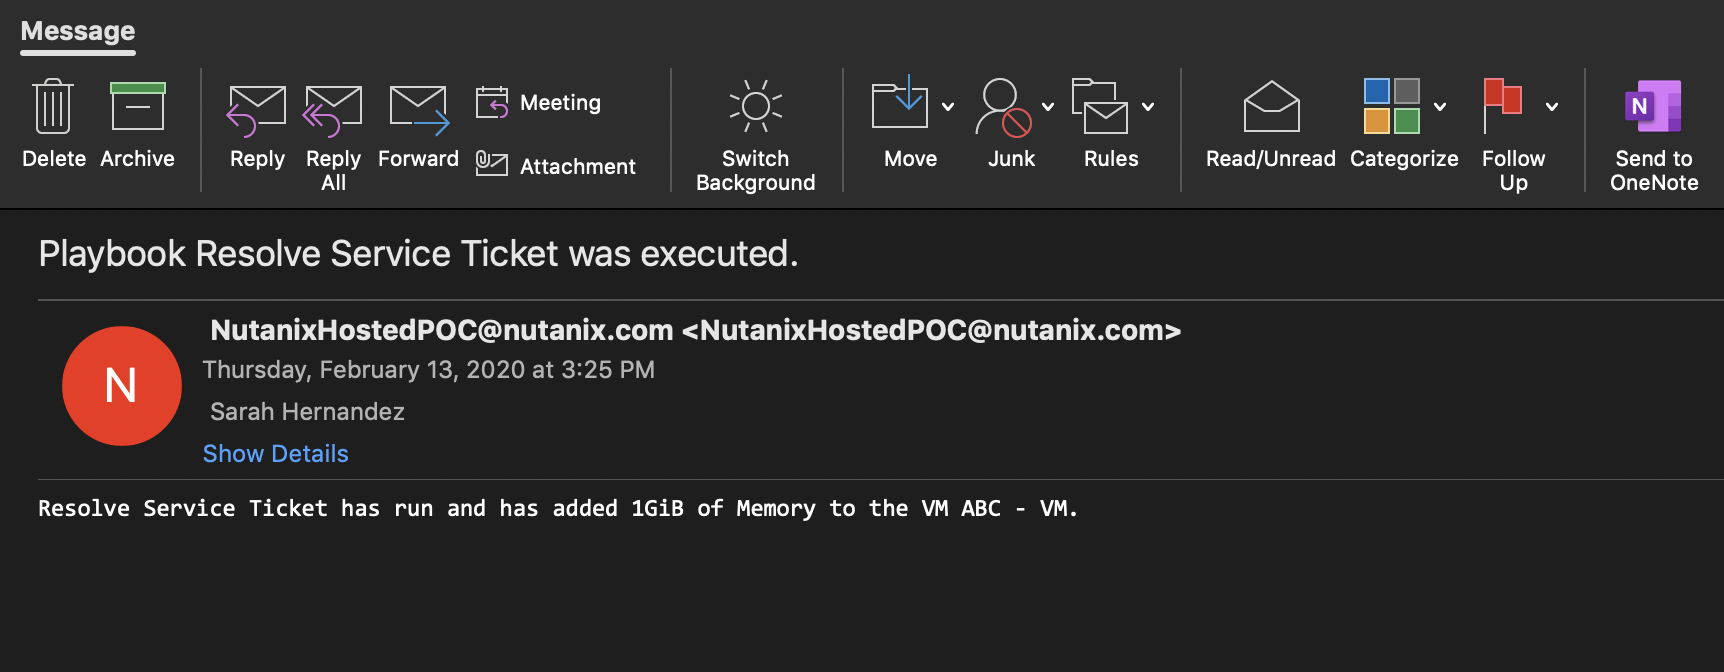
Playbook {{playbook.playbook_name}} was executed.Message: -
{{playbook.playbook_name}} has run and has added 1GiB of Memory to the VM {{trigger[0].entity1.name}}.
Note
You are welcome to compose your own subject message. The above is just an example. You could use the “parameters” to enrich the message.

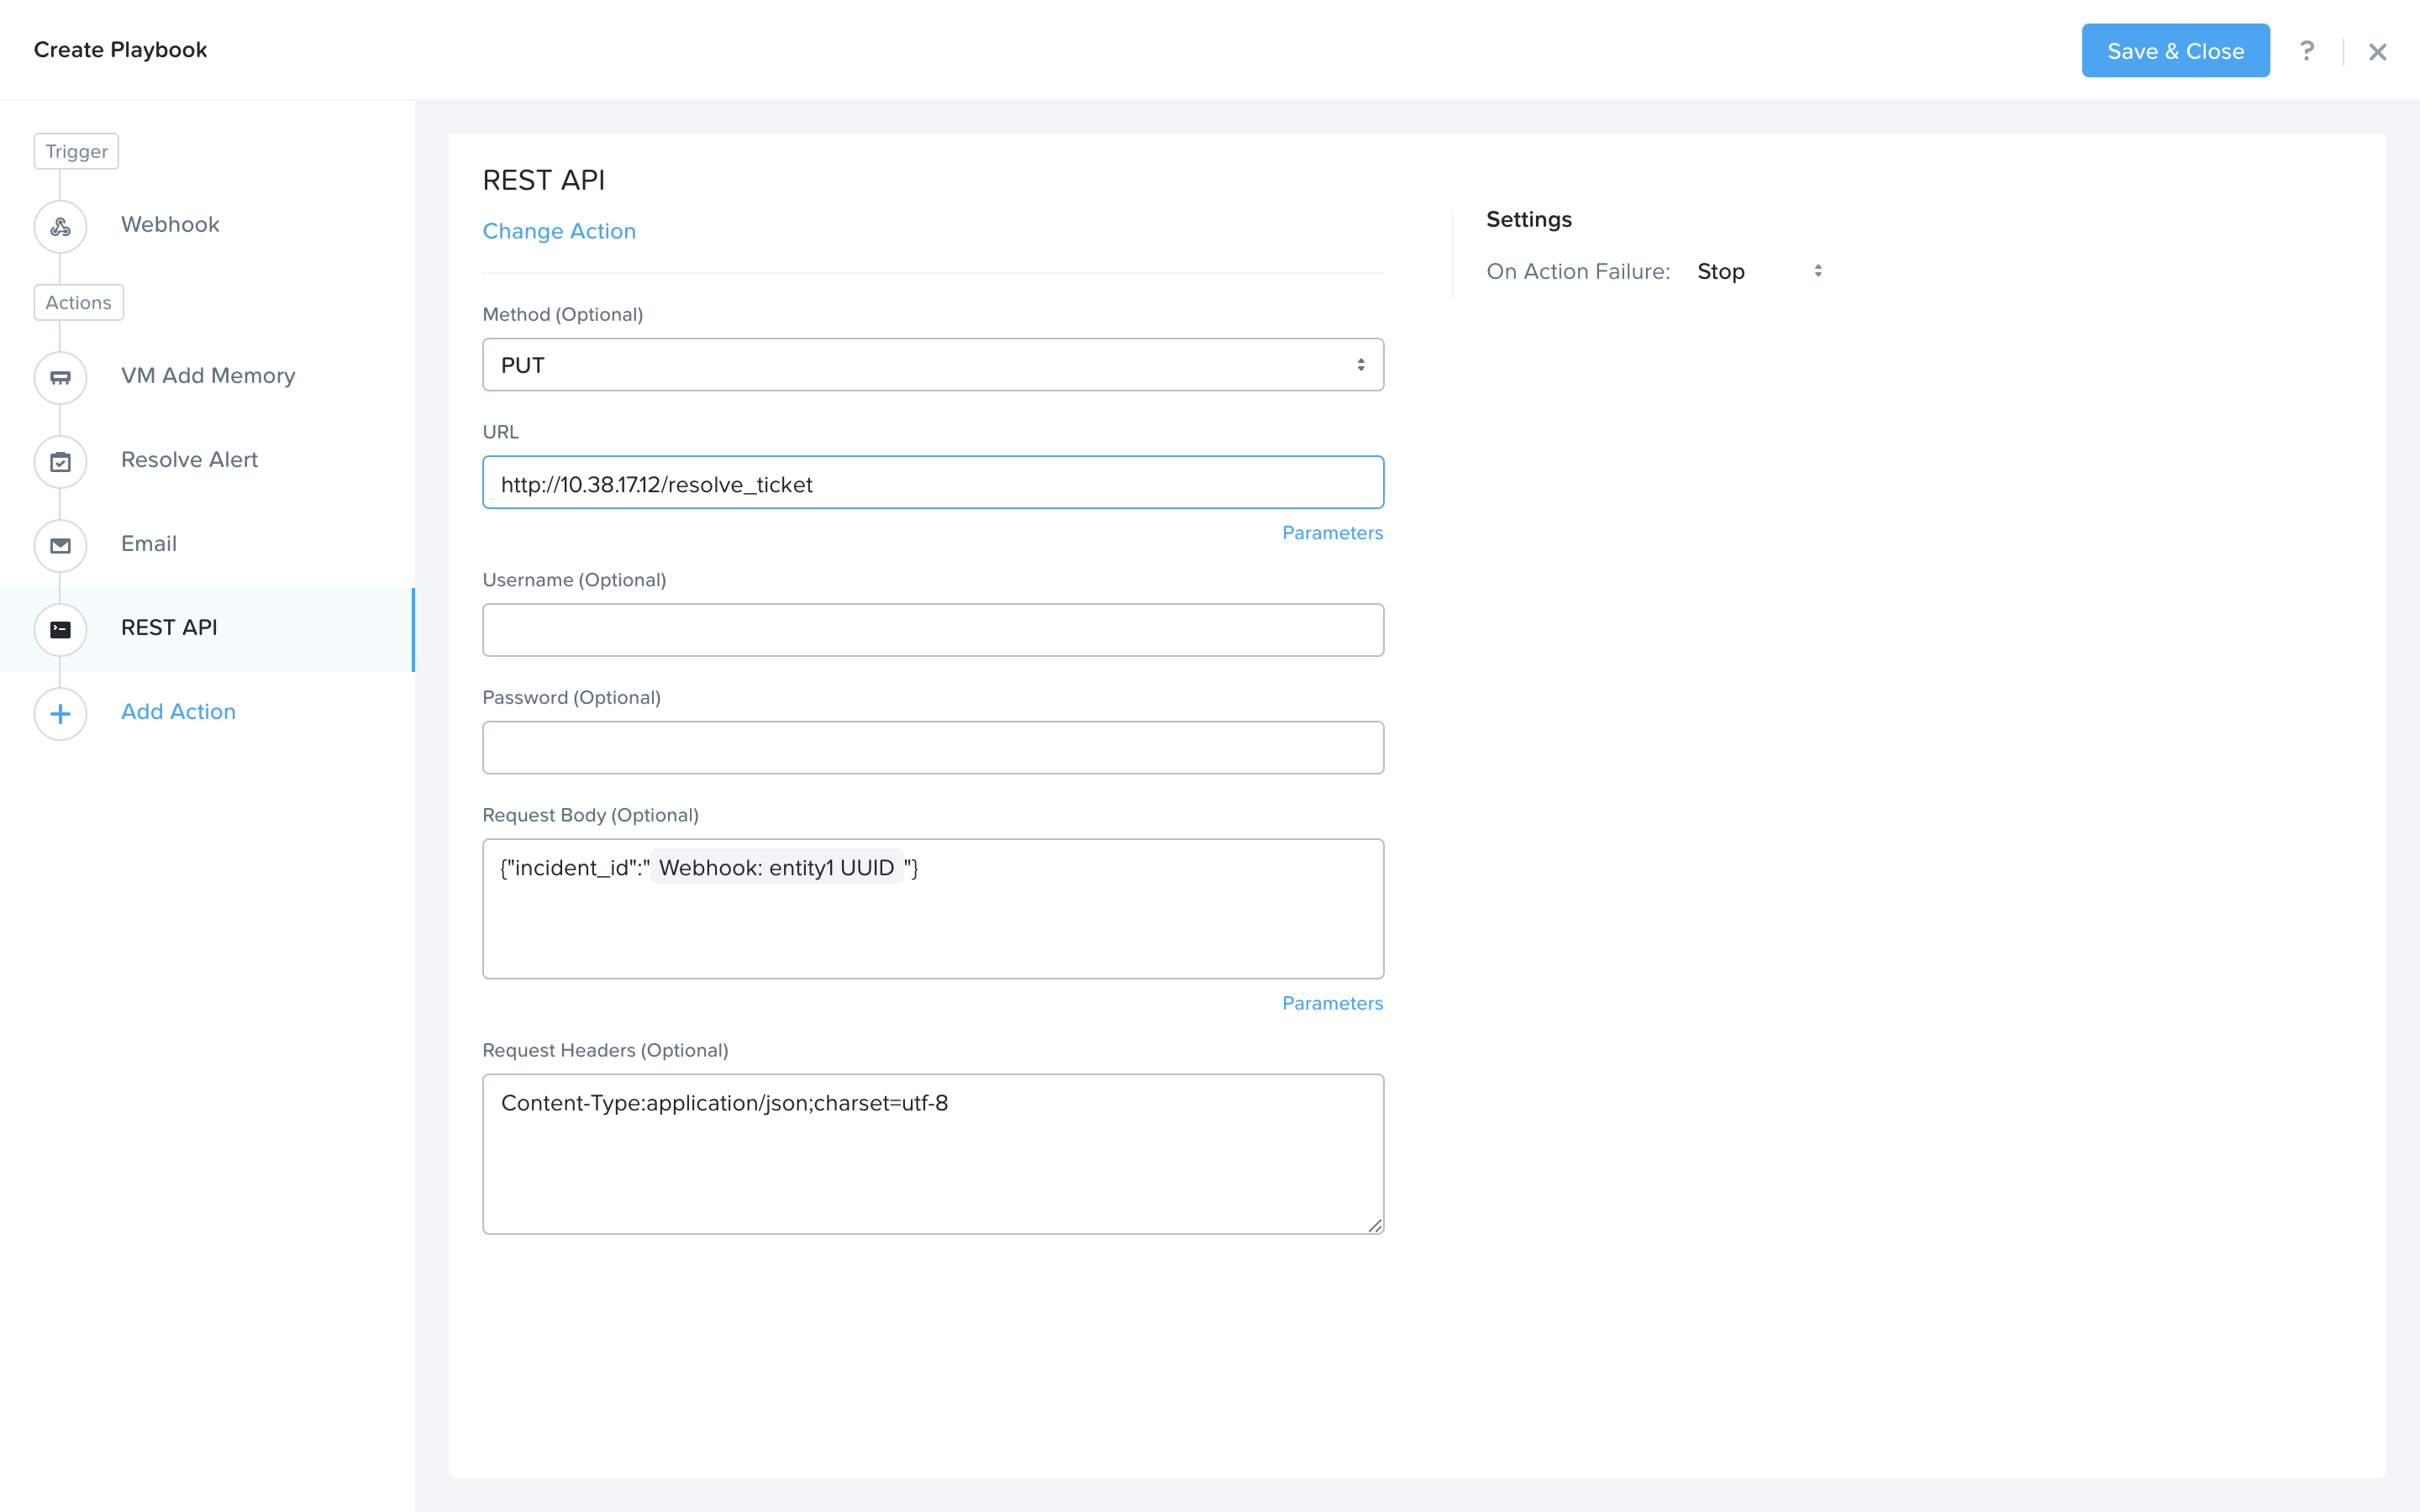
Last, we would like to call back to the ticket service to resolve the ticket in the ticket service. Click Add Action to add the REST API action. Fill in the following values replacing the <PrismOpsLabUtilityServer_IP_ADDRESS> in the URL field.
Method: PUT
URL: http://<PrismOpsLabUtilityServer_IP_ADDRESS>/resolve_ticket
Request Body:
{"incident_id":"{{trigger[0].entity1.uuid}}"}Request Header: Content-Type:application/json;charset=utf-8
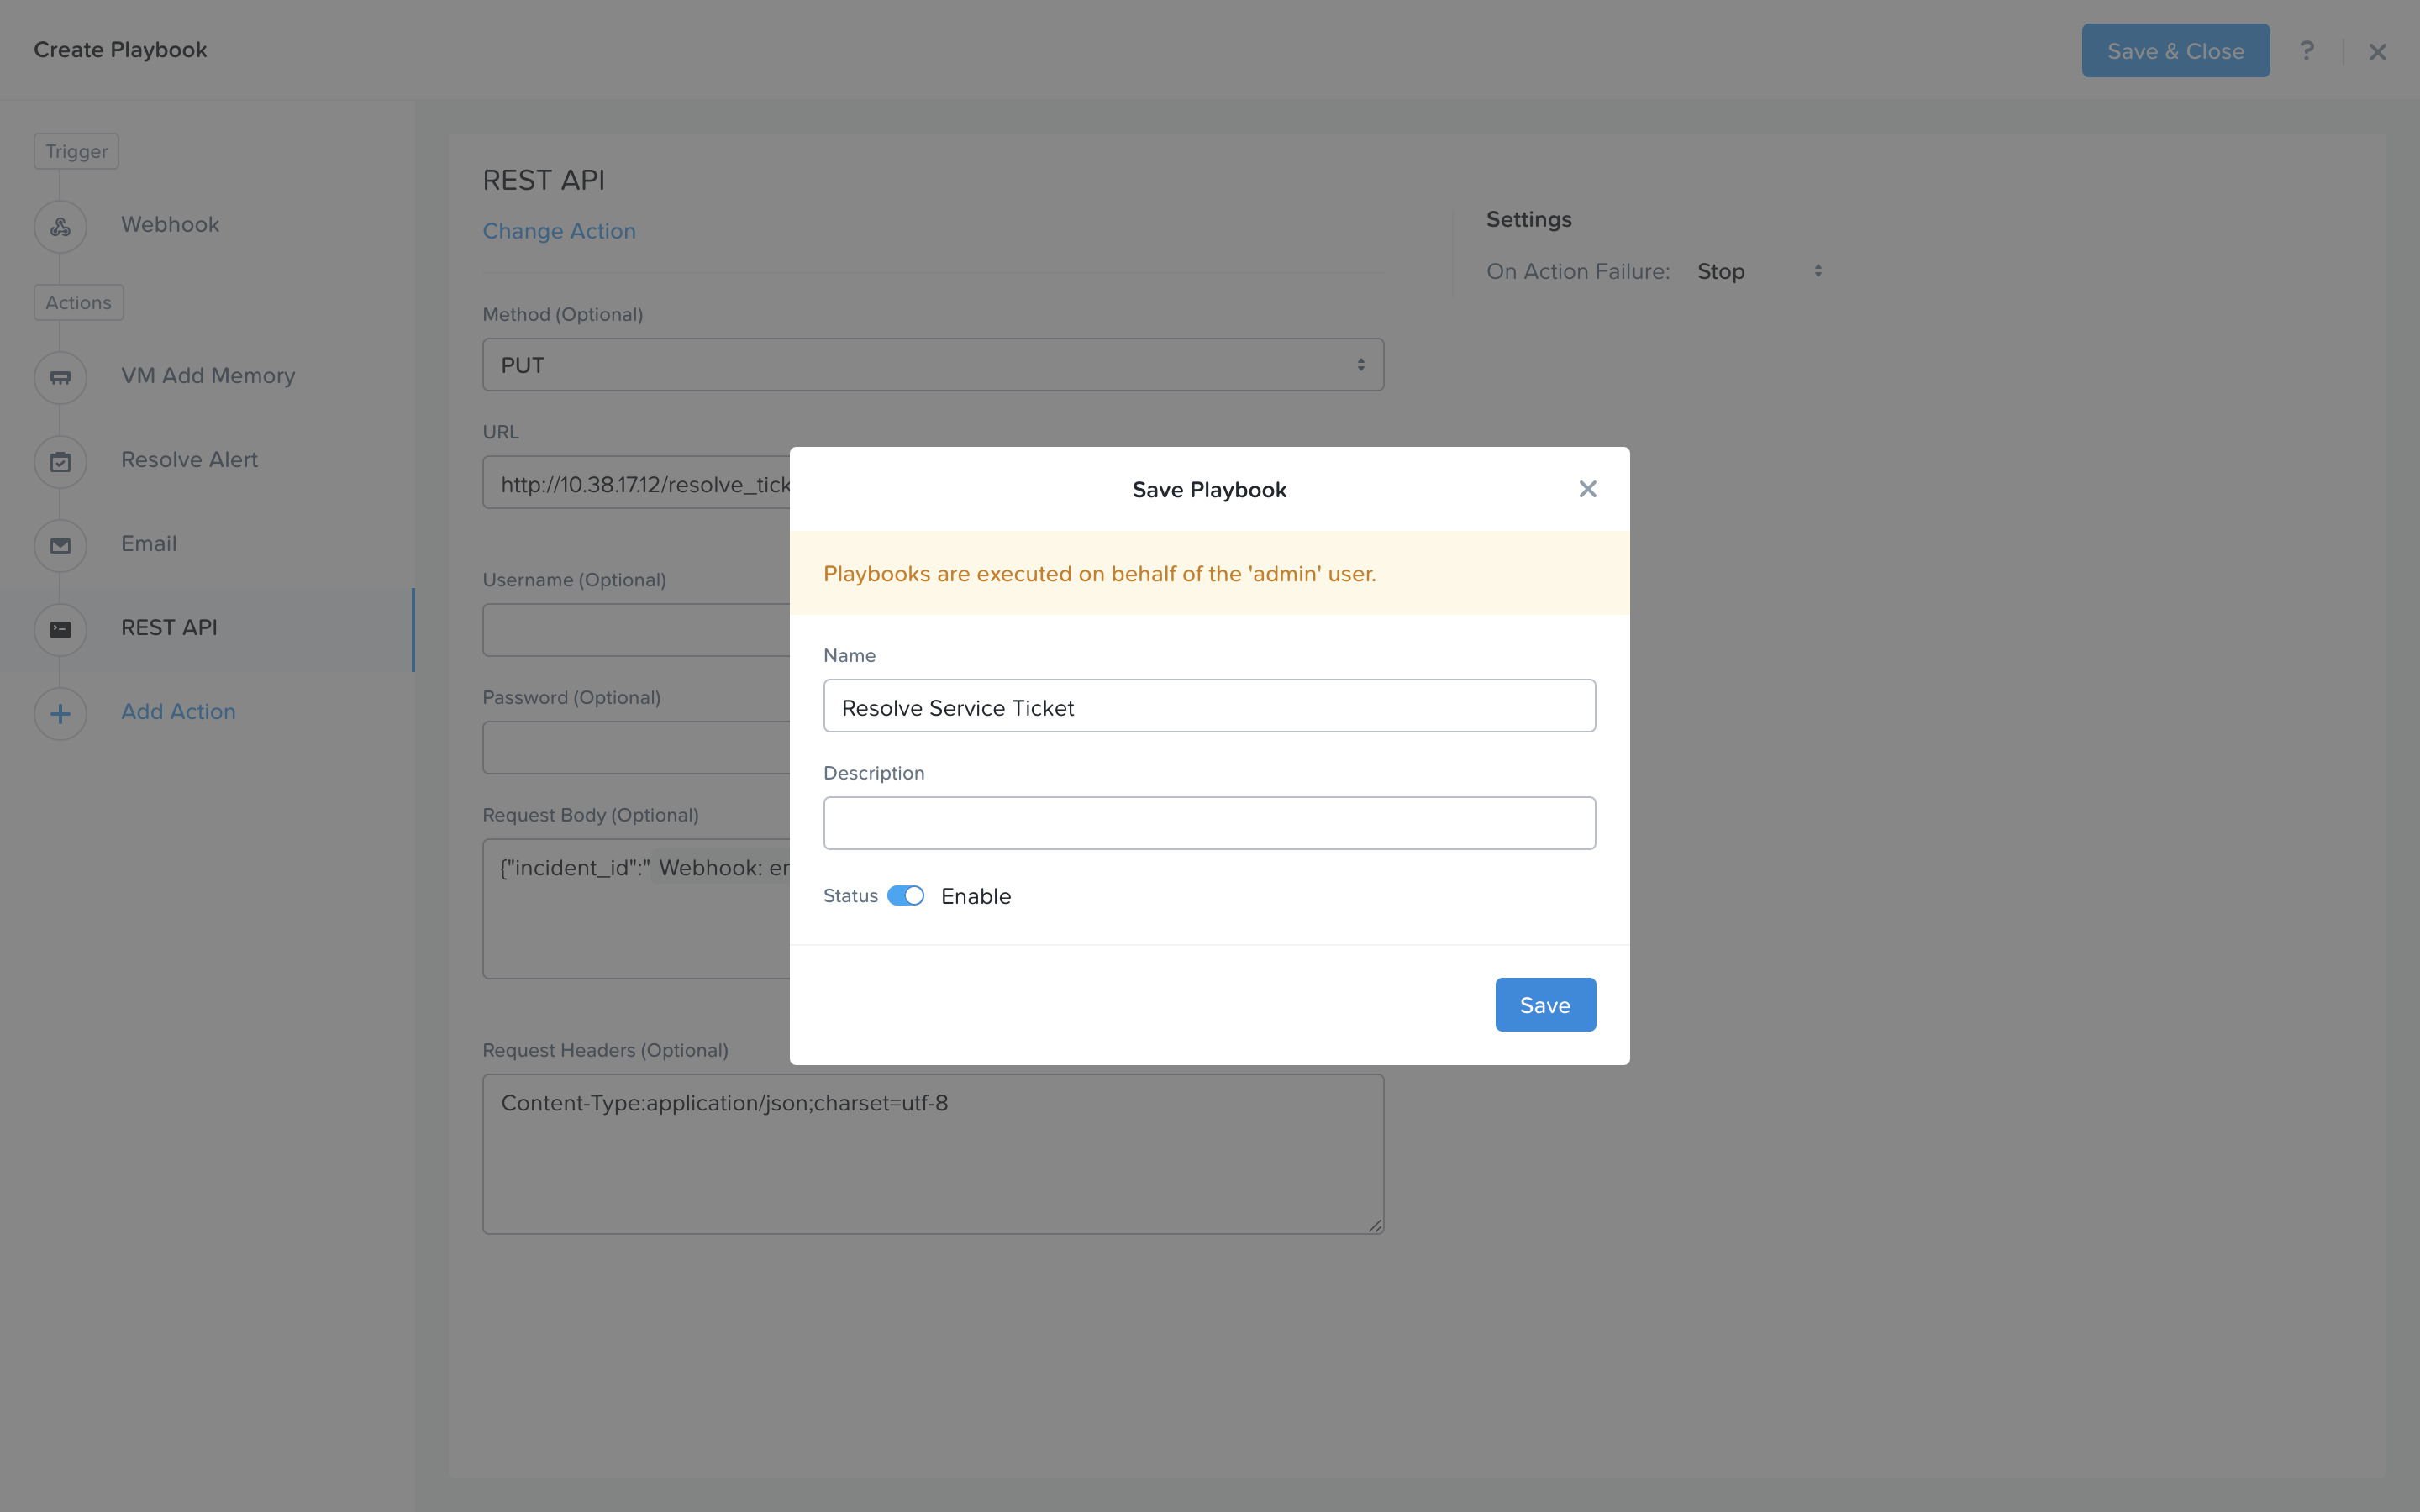
Click Save & Close button and save it with a name “Initials - Resolve Service Ticket”. Be sure to enable the ‘Enabled’ toggle.
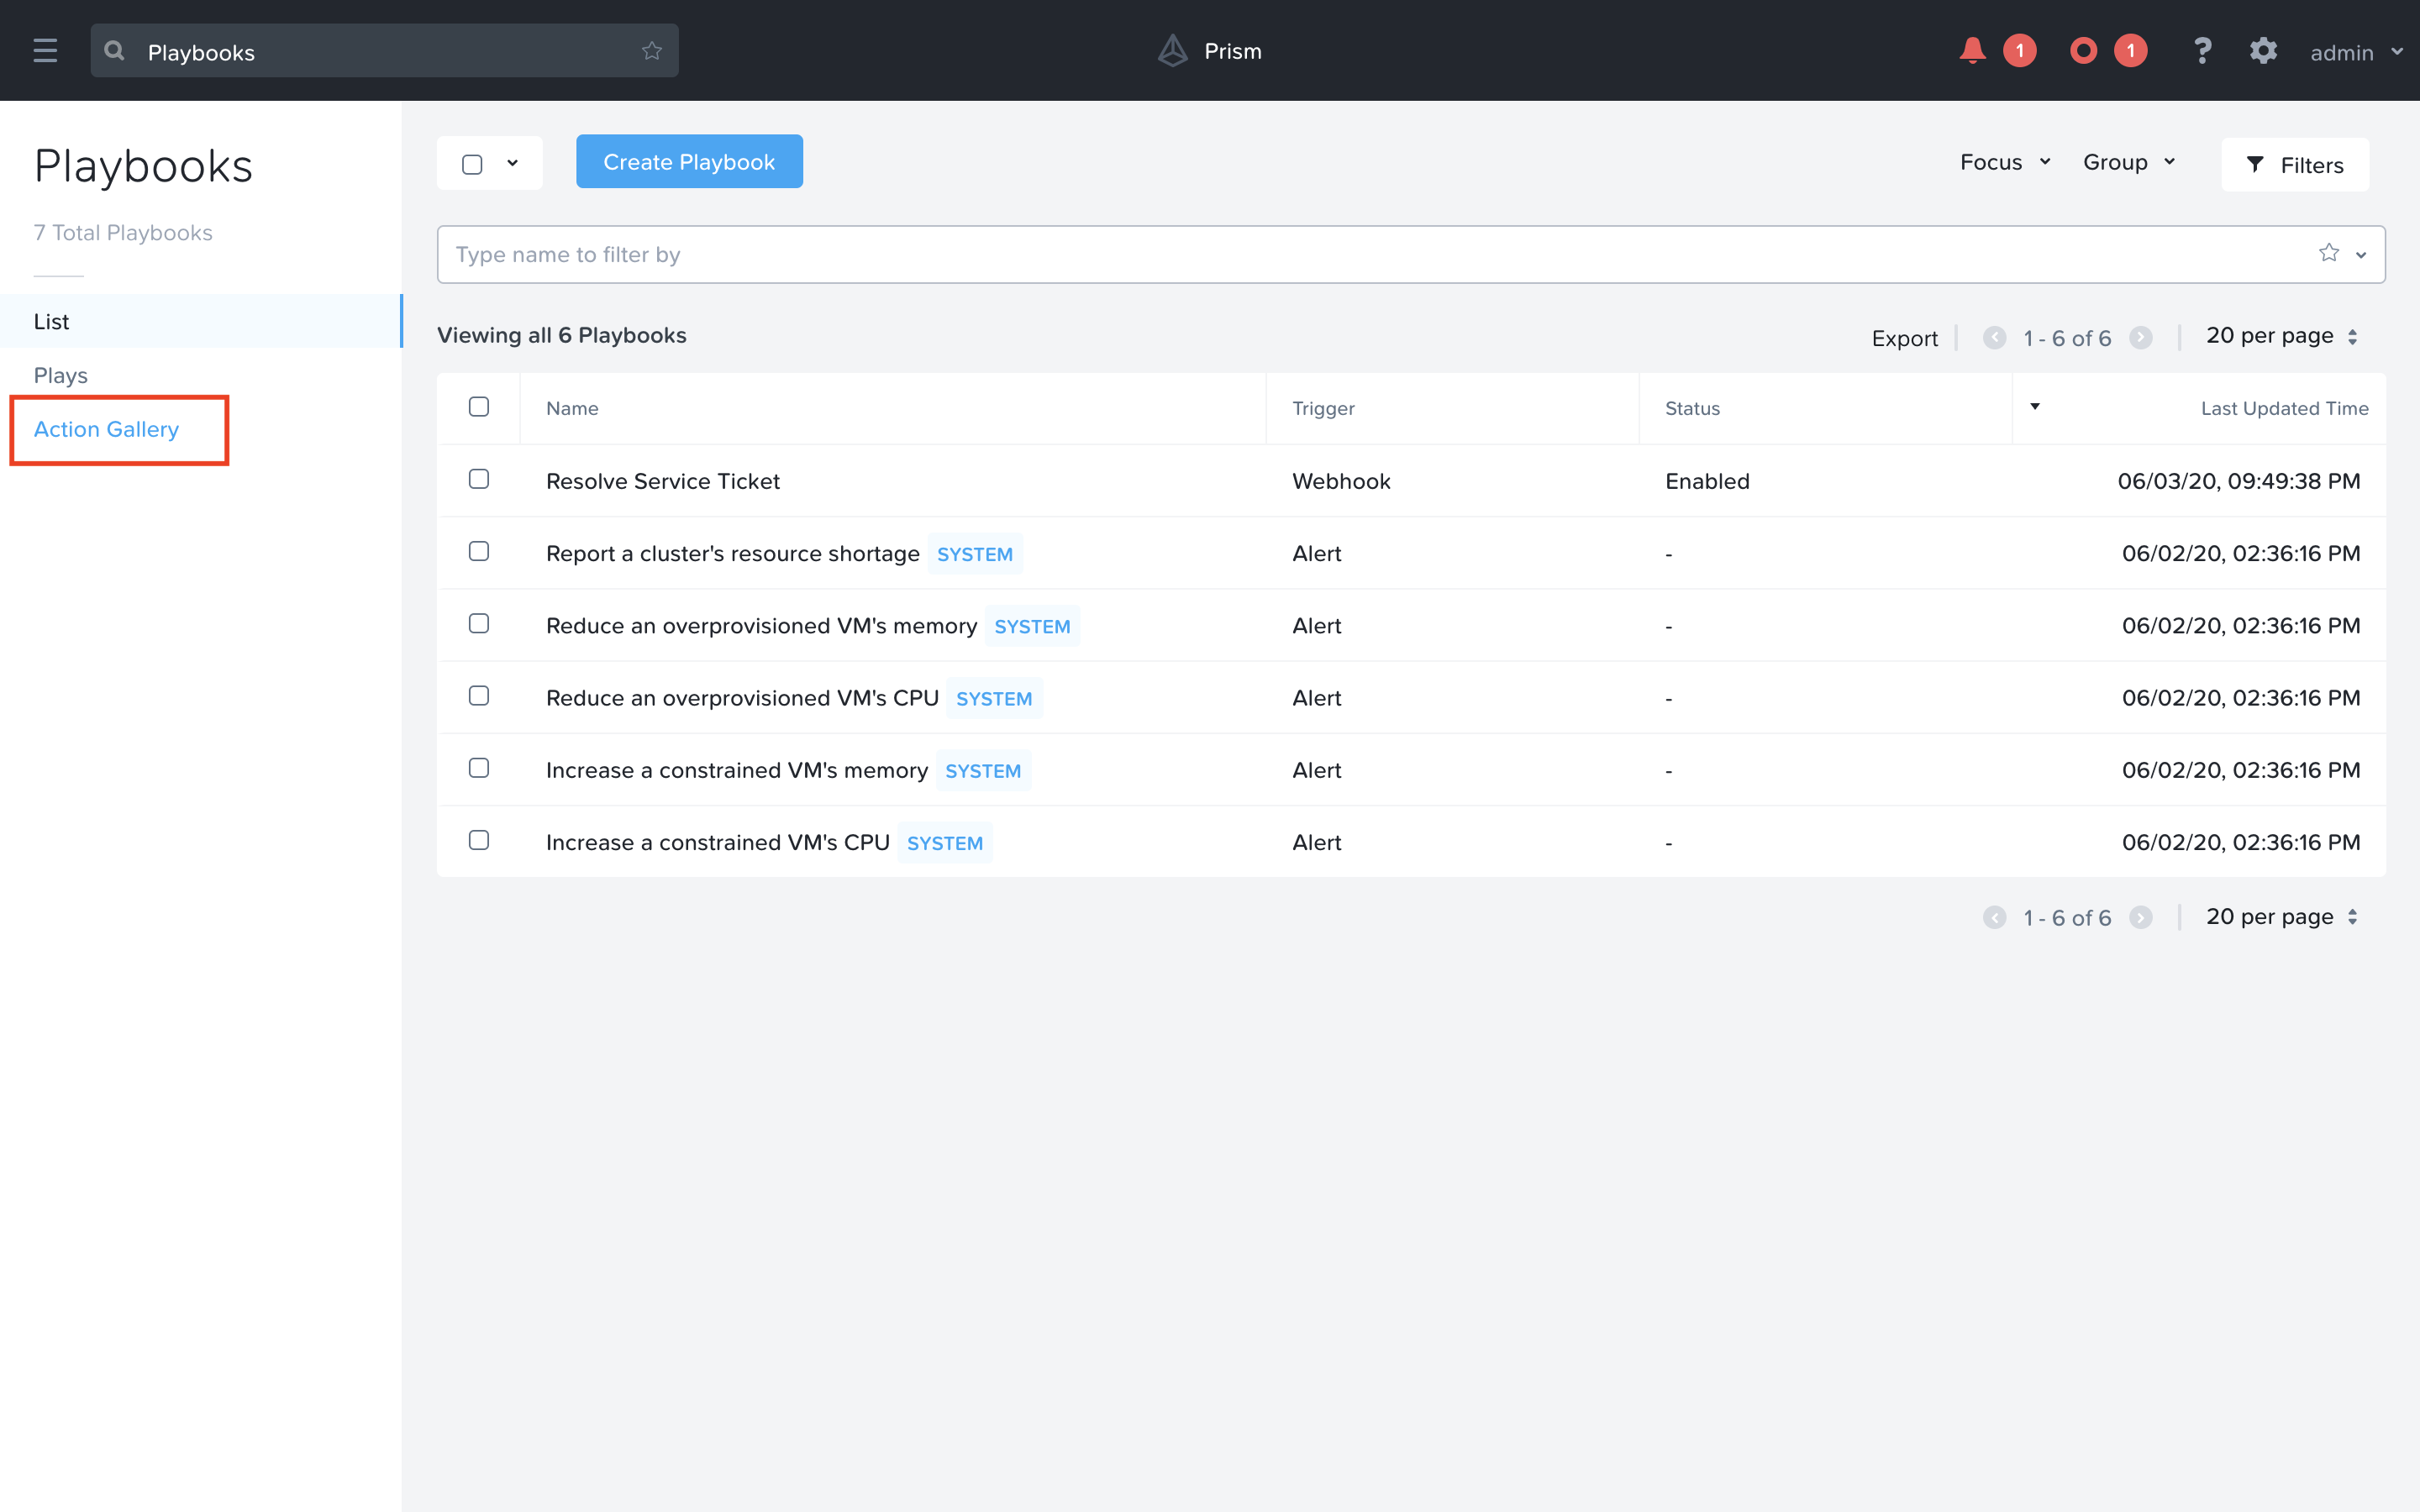
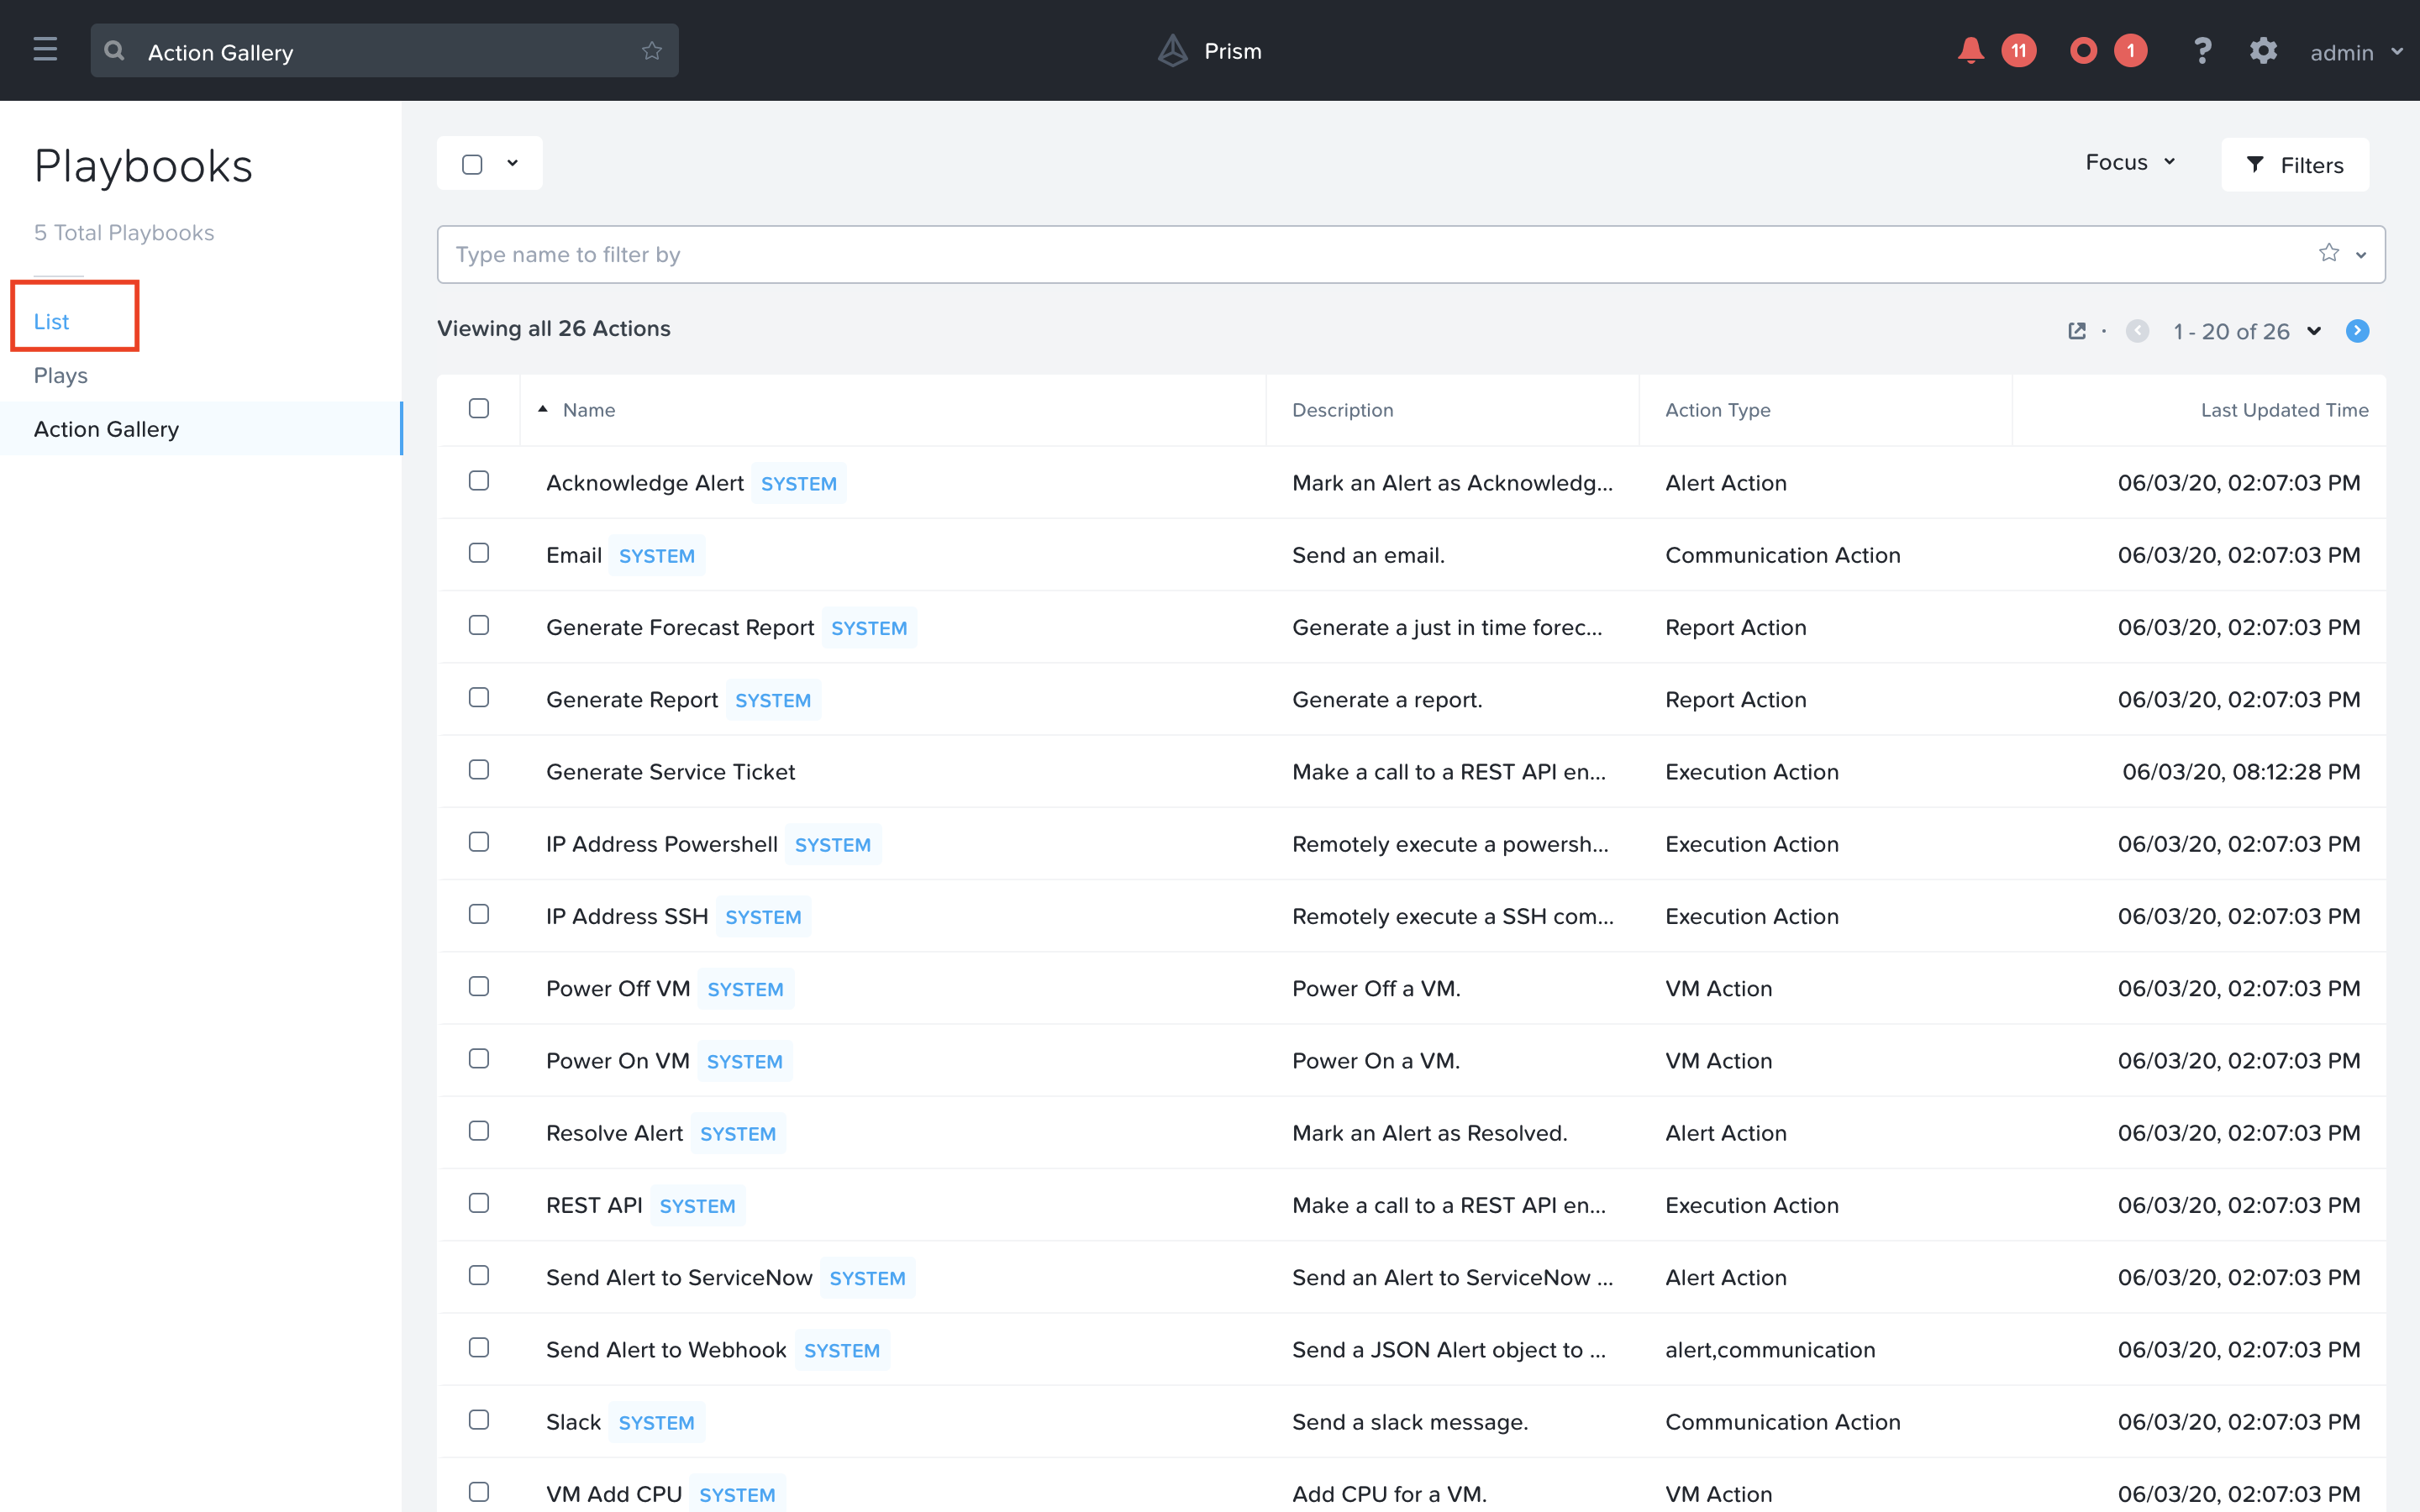
Next we will create a custom action to be used in our 2nd playbook. Click on Action Gallery from the left hand side menu.
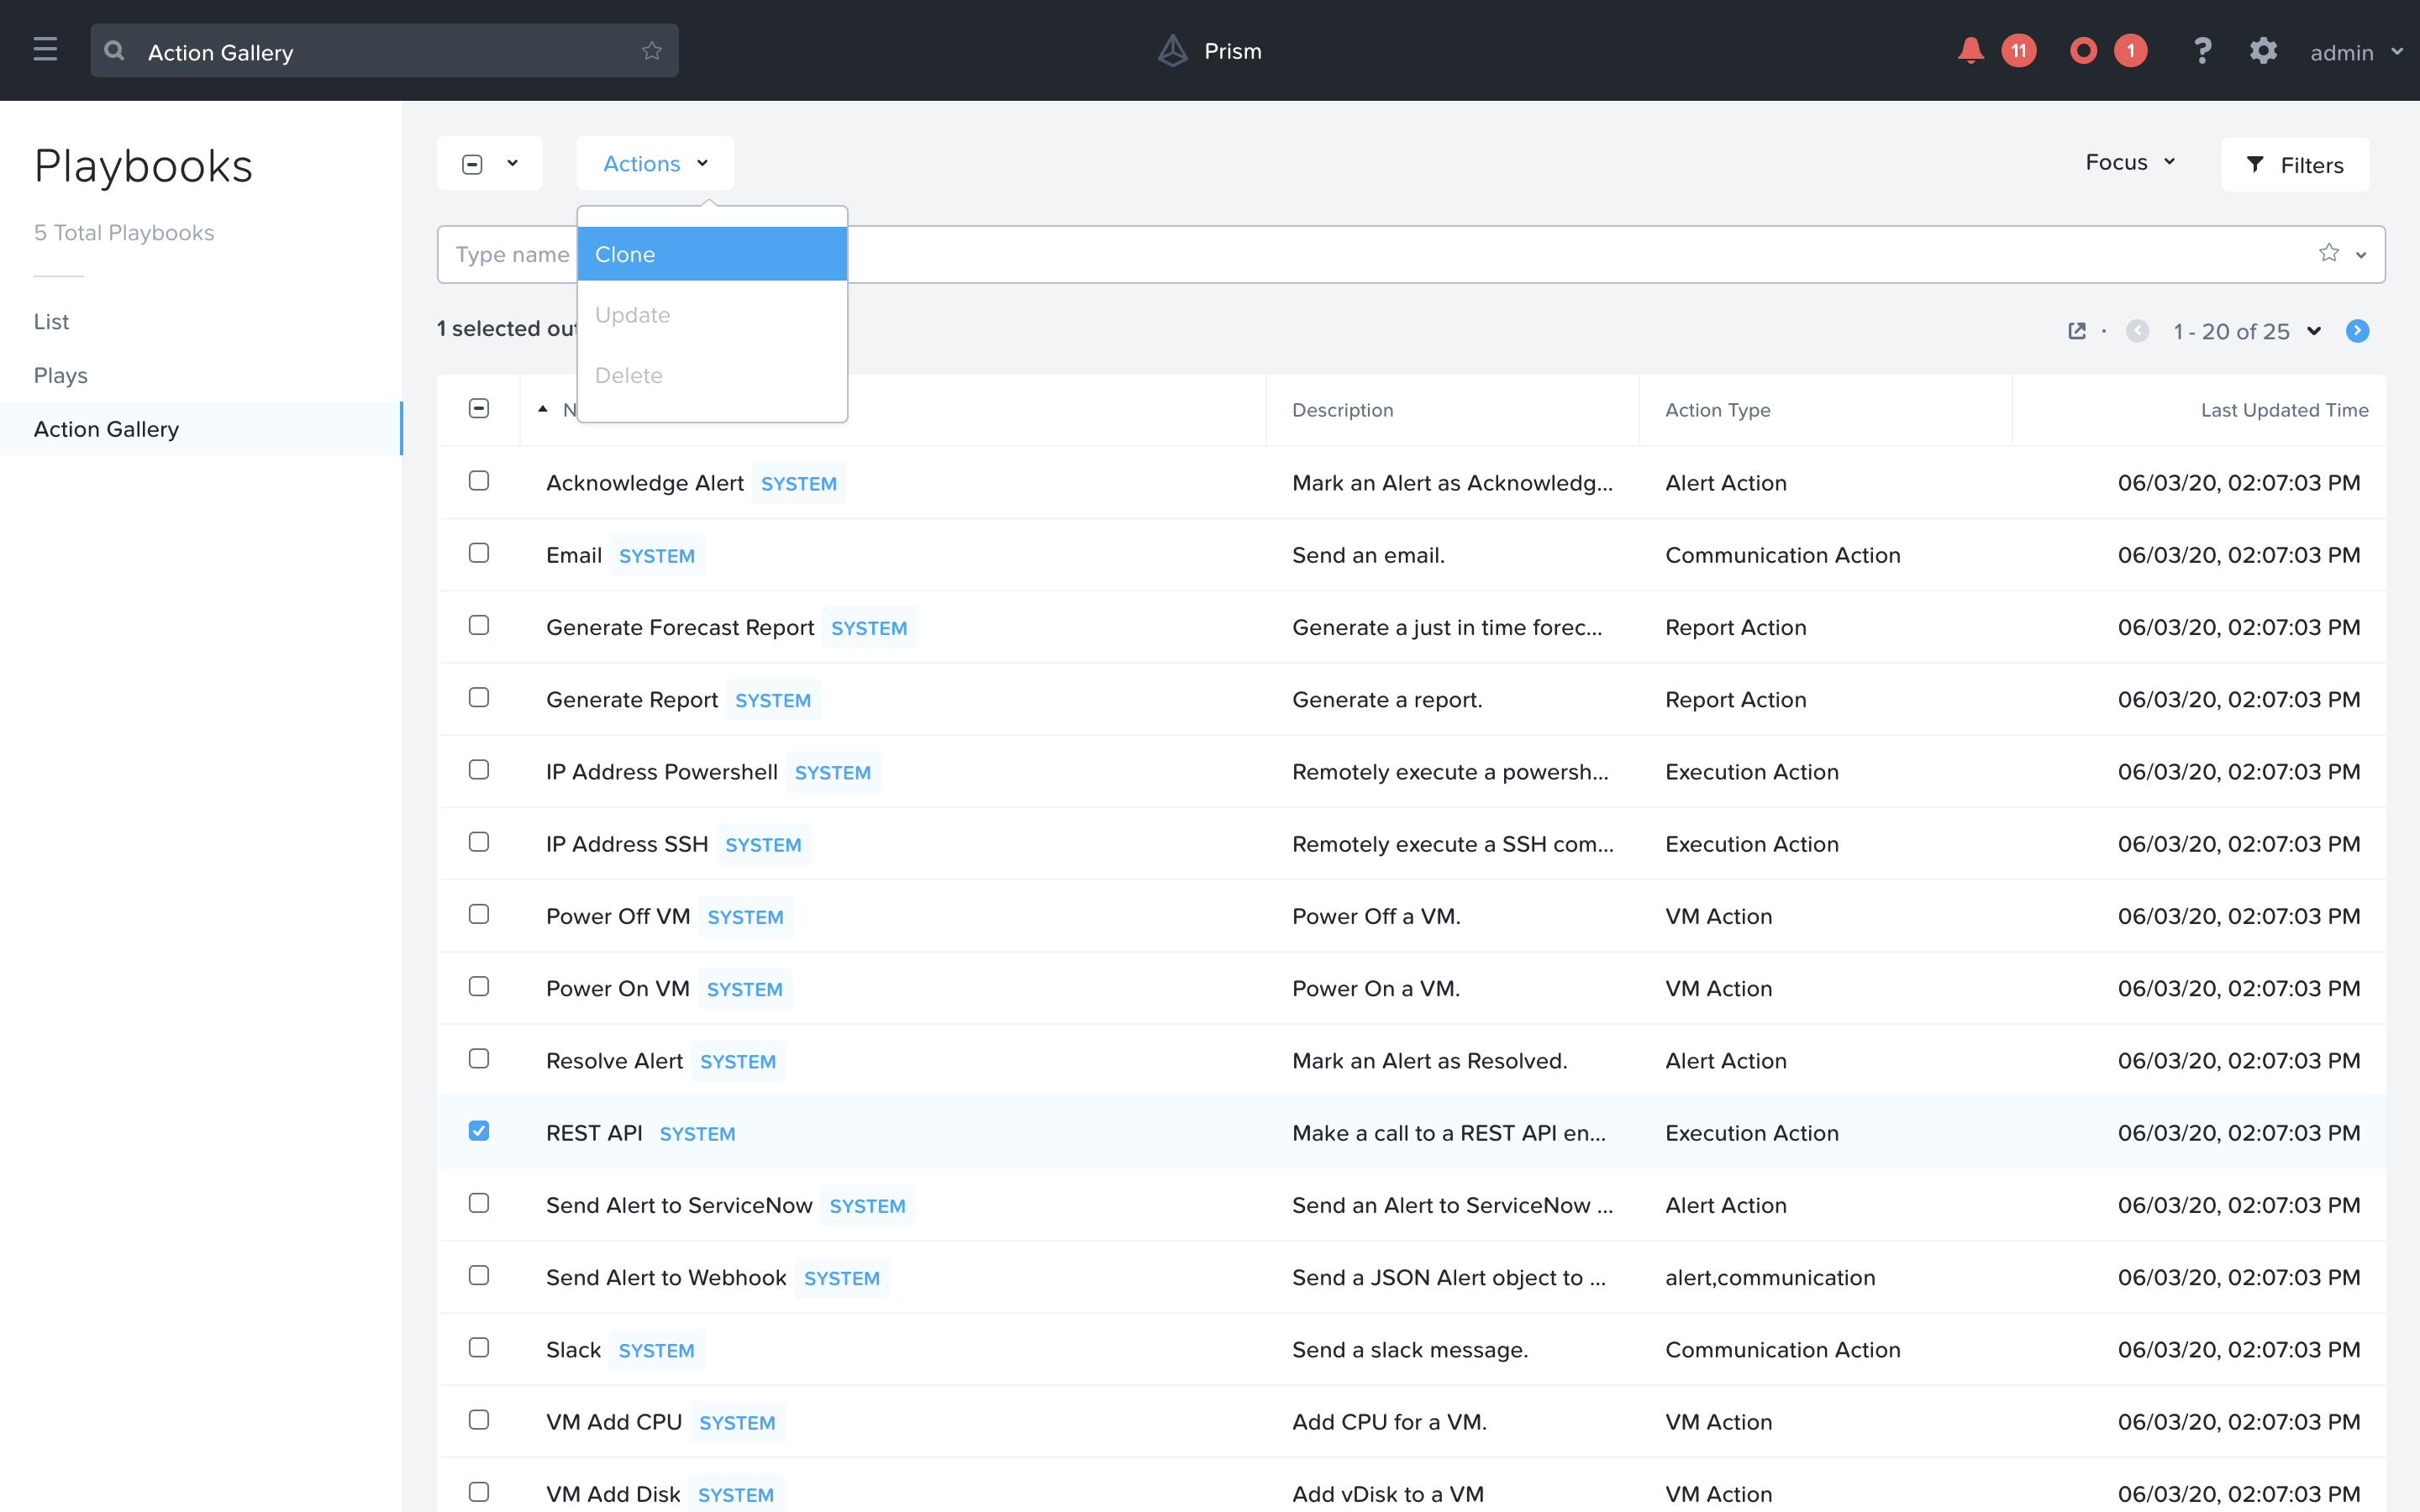
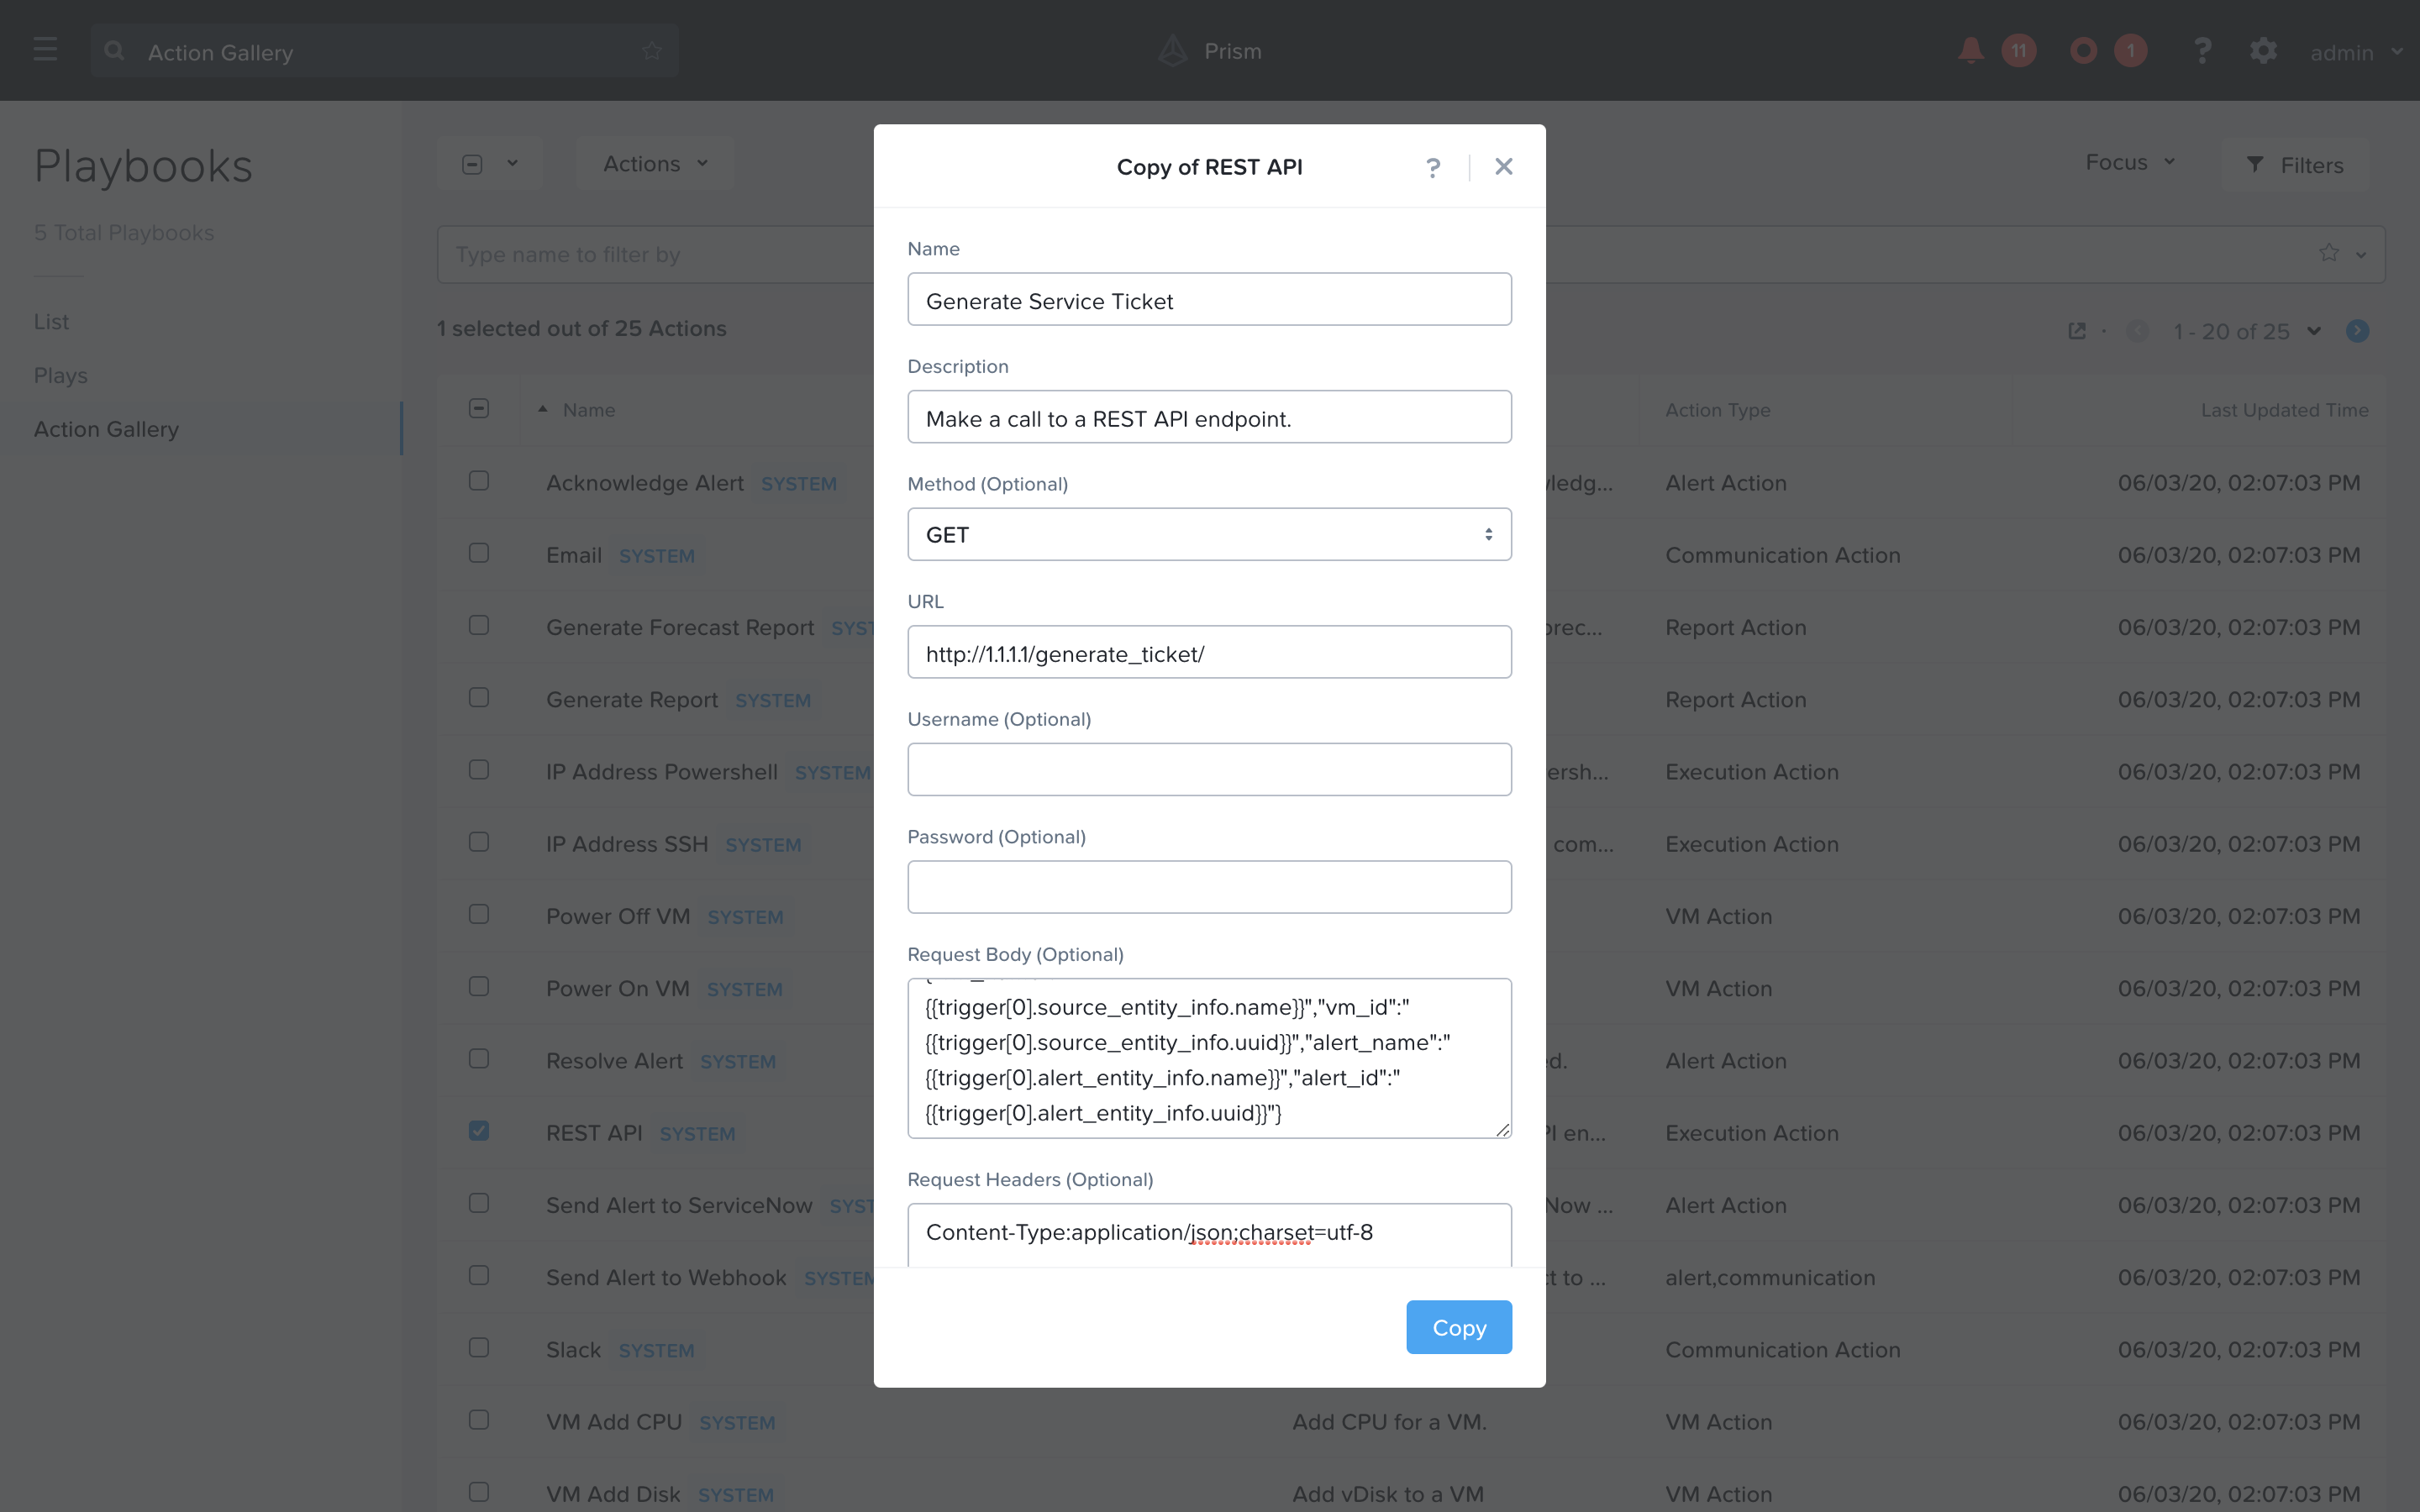
Select the REST API action and choose the Clone operation from the actions menu.
Fill in the following values replacing your initials in the Initials part, and the <PrismOpsLabUtilityServer_IP_ADDRESS> in the URL field. Click Copy.
Name: Initials - Generate Service Ticket
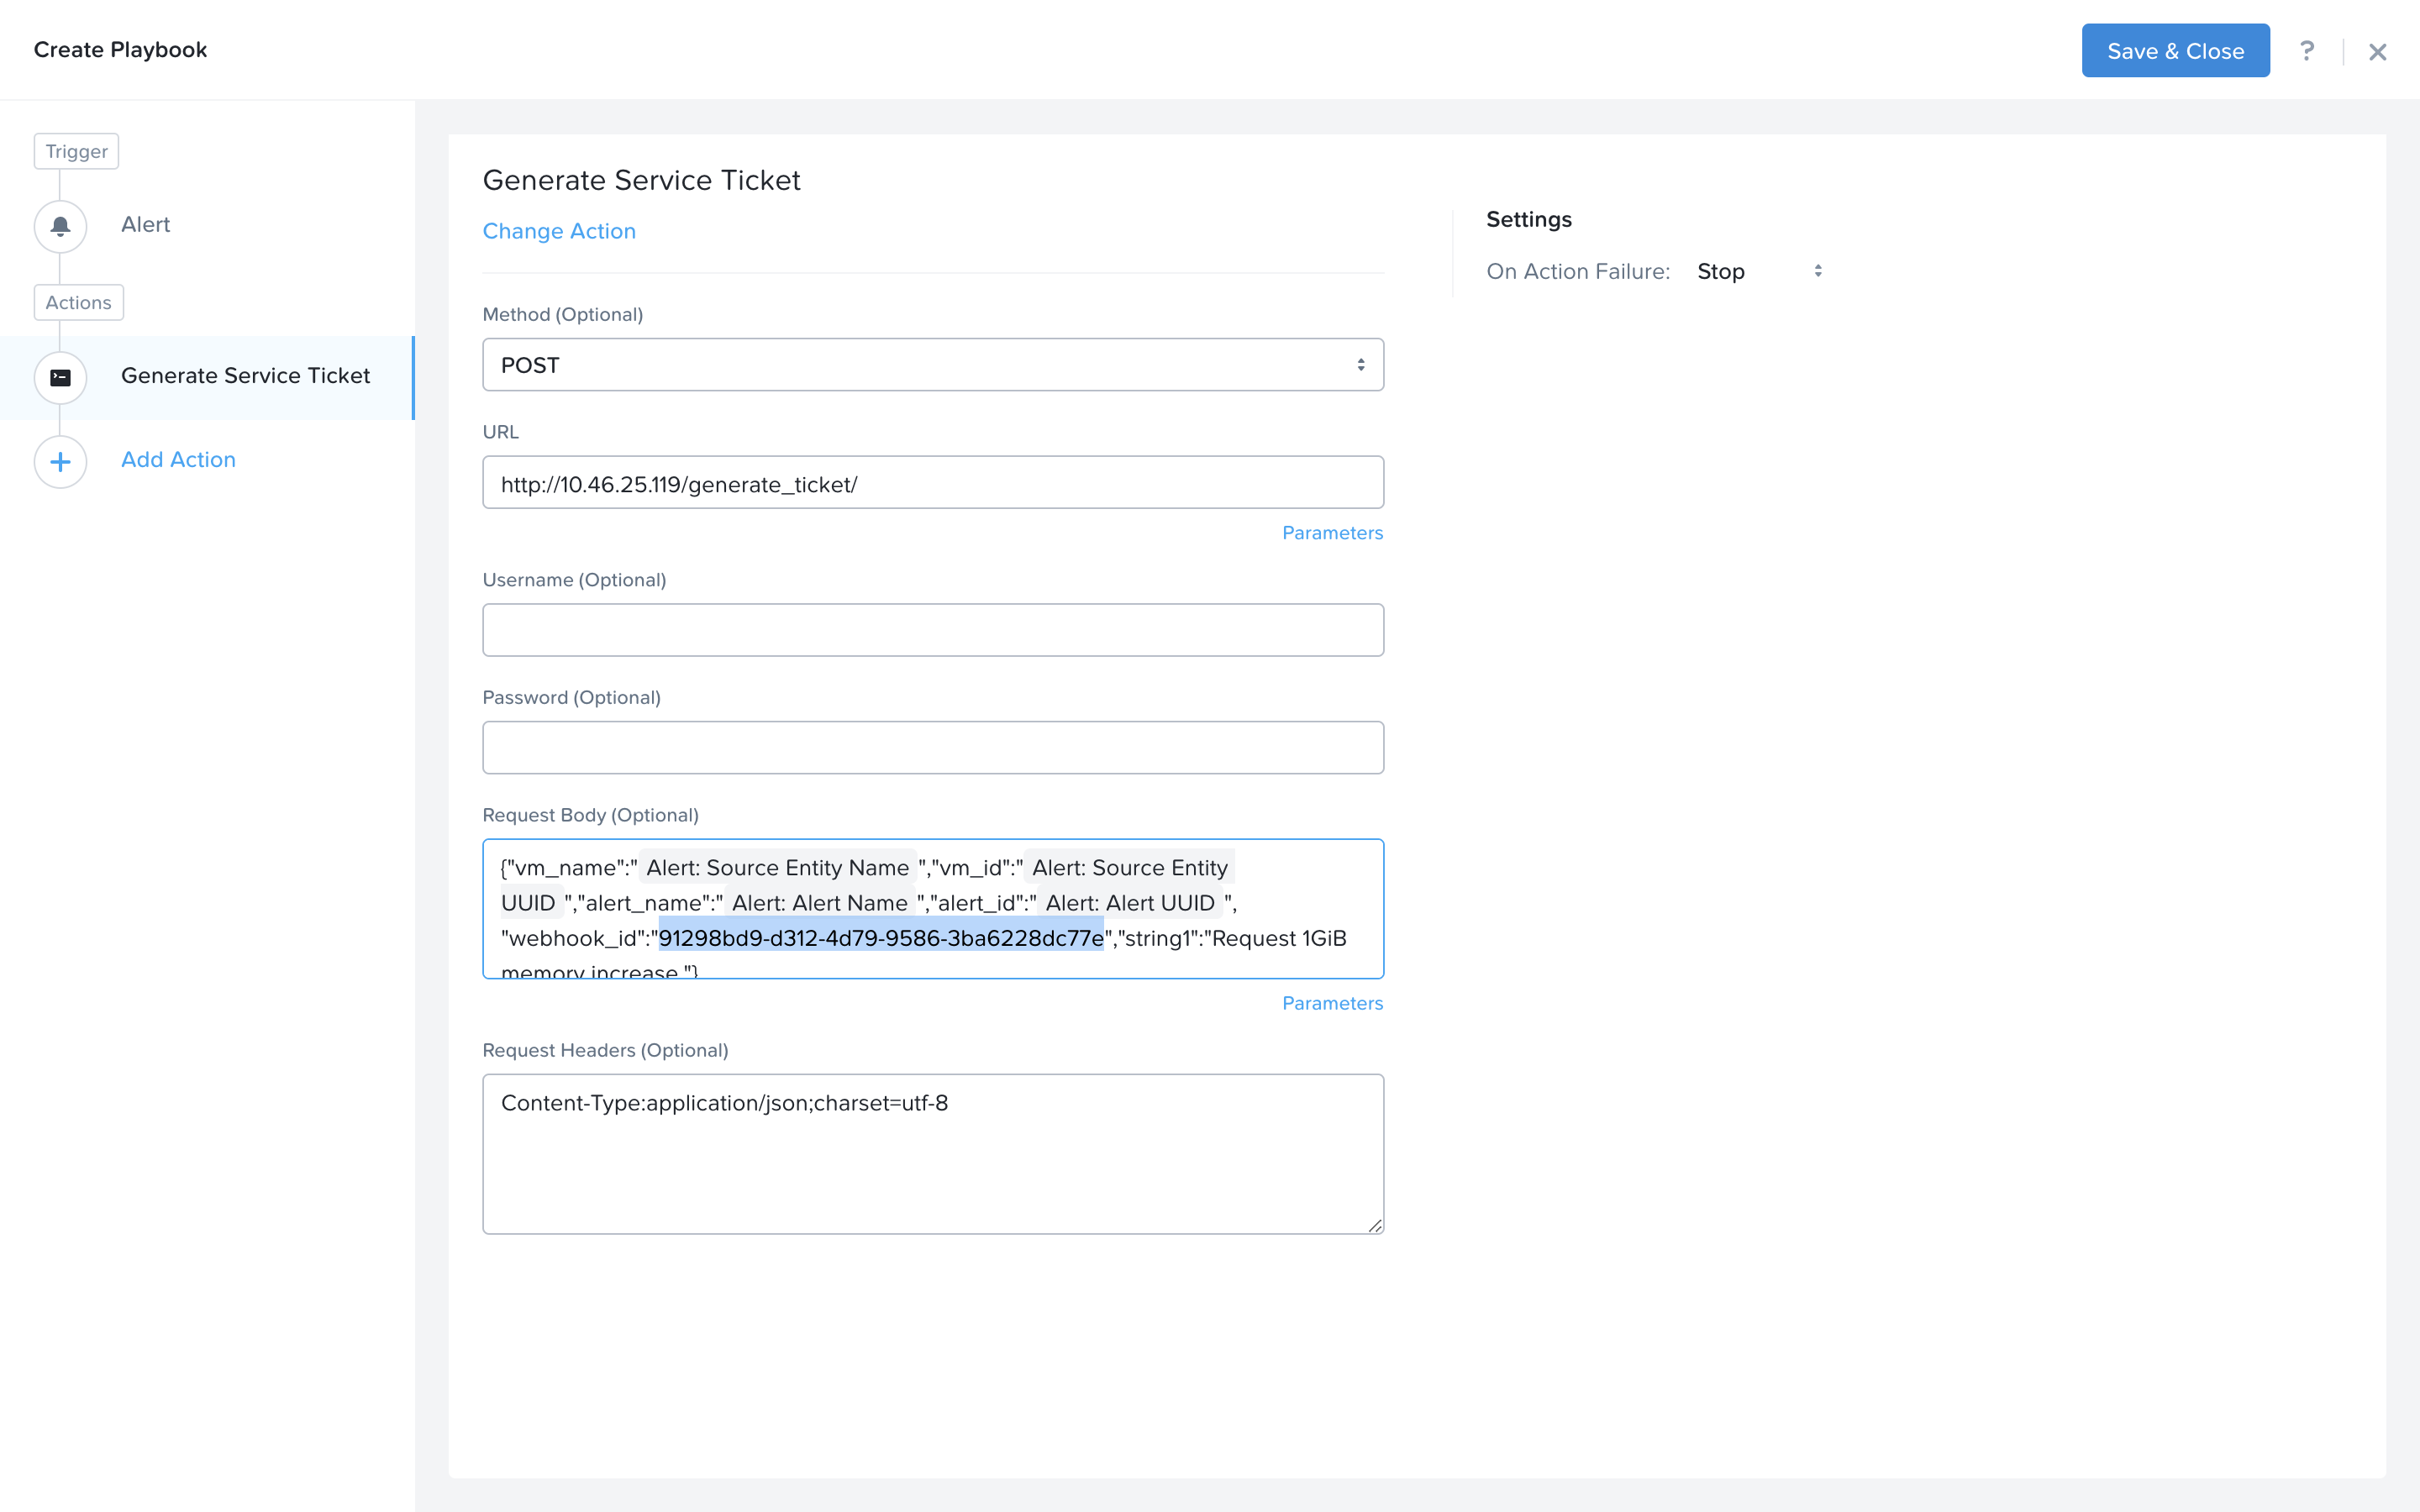
Method: POST
URL: http://<PrismOpsLabUtilityServer_IP_ADDRESS>/generate_ticket/
Request Body:
{"vm_name":"{{trigger[0].source_entity_info.name}}","vm_id":"{{trigger[0].source_entity_info.uuid}}","alert_name":"{{trigger[0].alert_entity_info.name}}","alert_id":"{{trigger[0].alert_entity_info.uuid}}", "webhook_id":"<ENTER_ID_HERE>","string1":"Request 1GiB memory increase."}Request Header: Content-Type:application/json;charset=utf-8
Now switch to the Playbooks list by clicking the List item in the left hand menu.
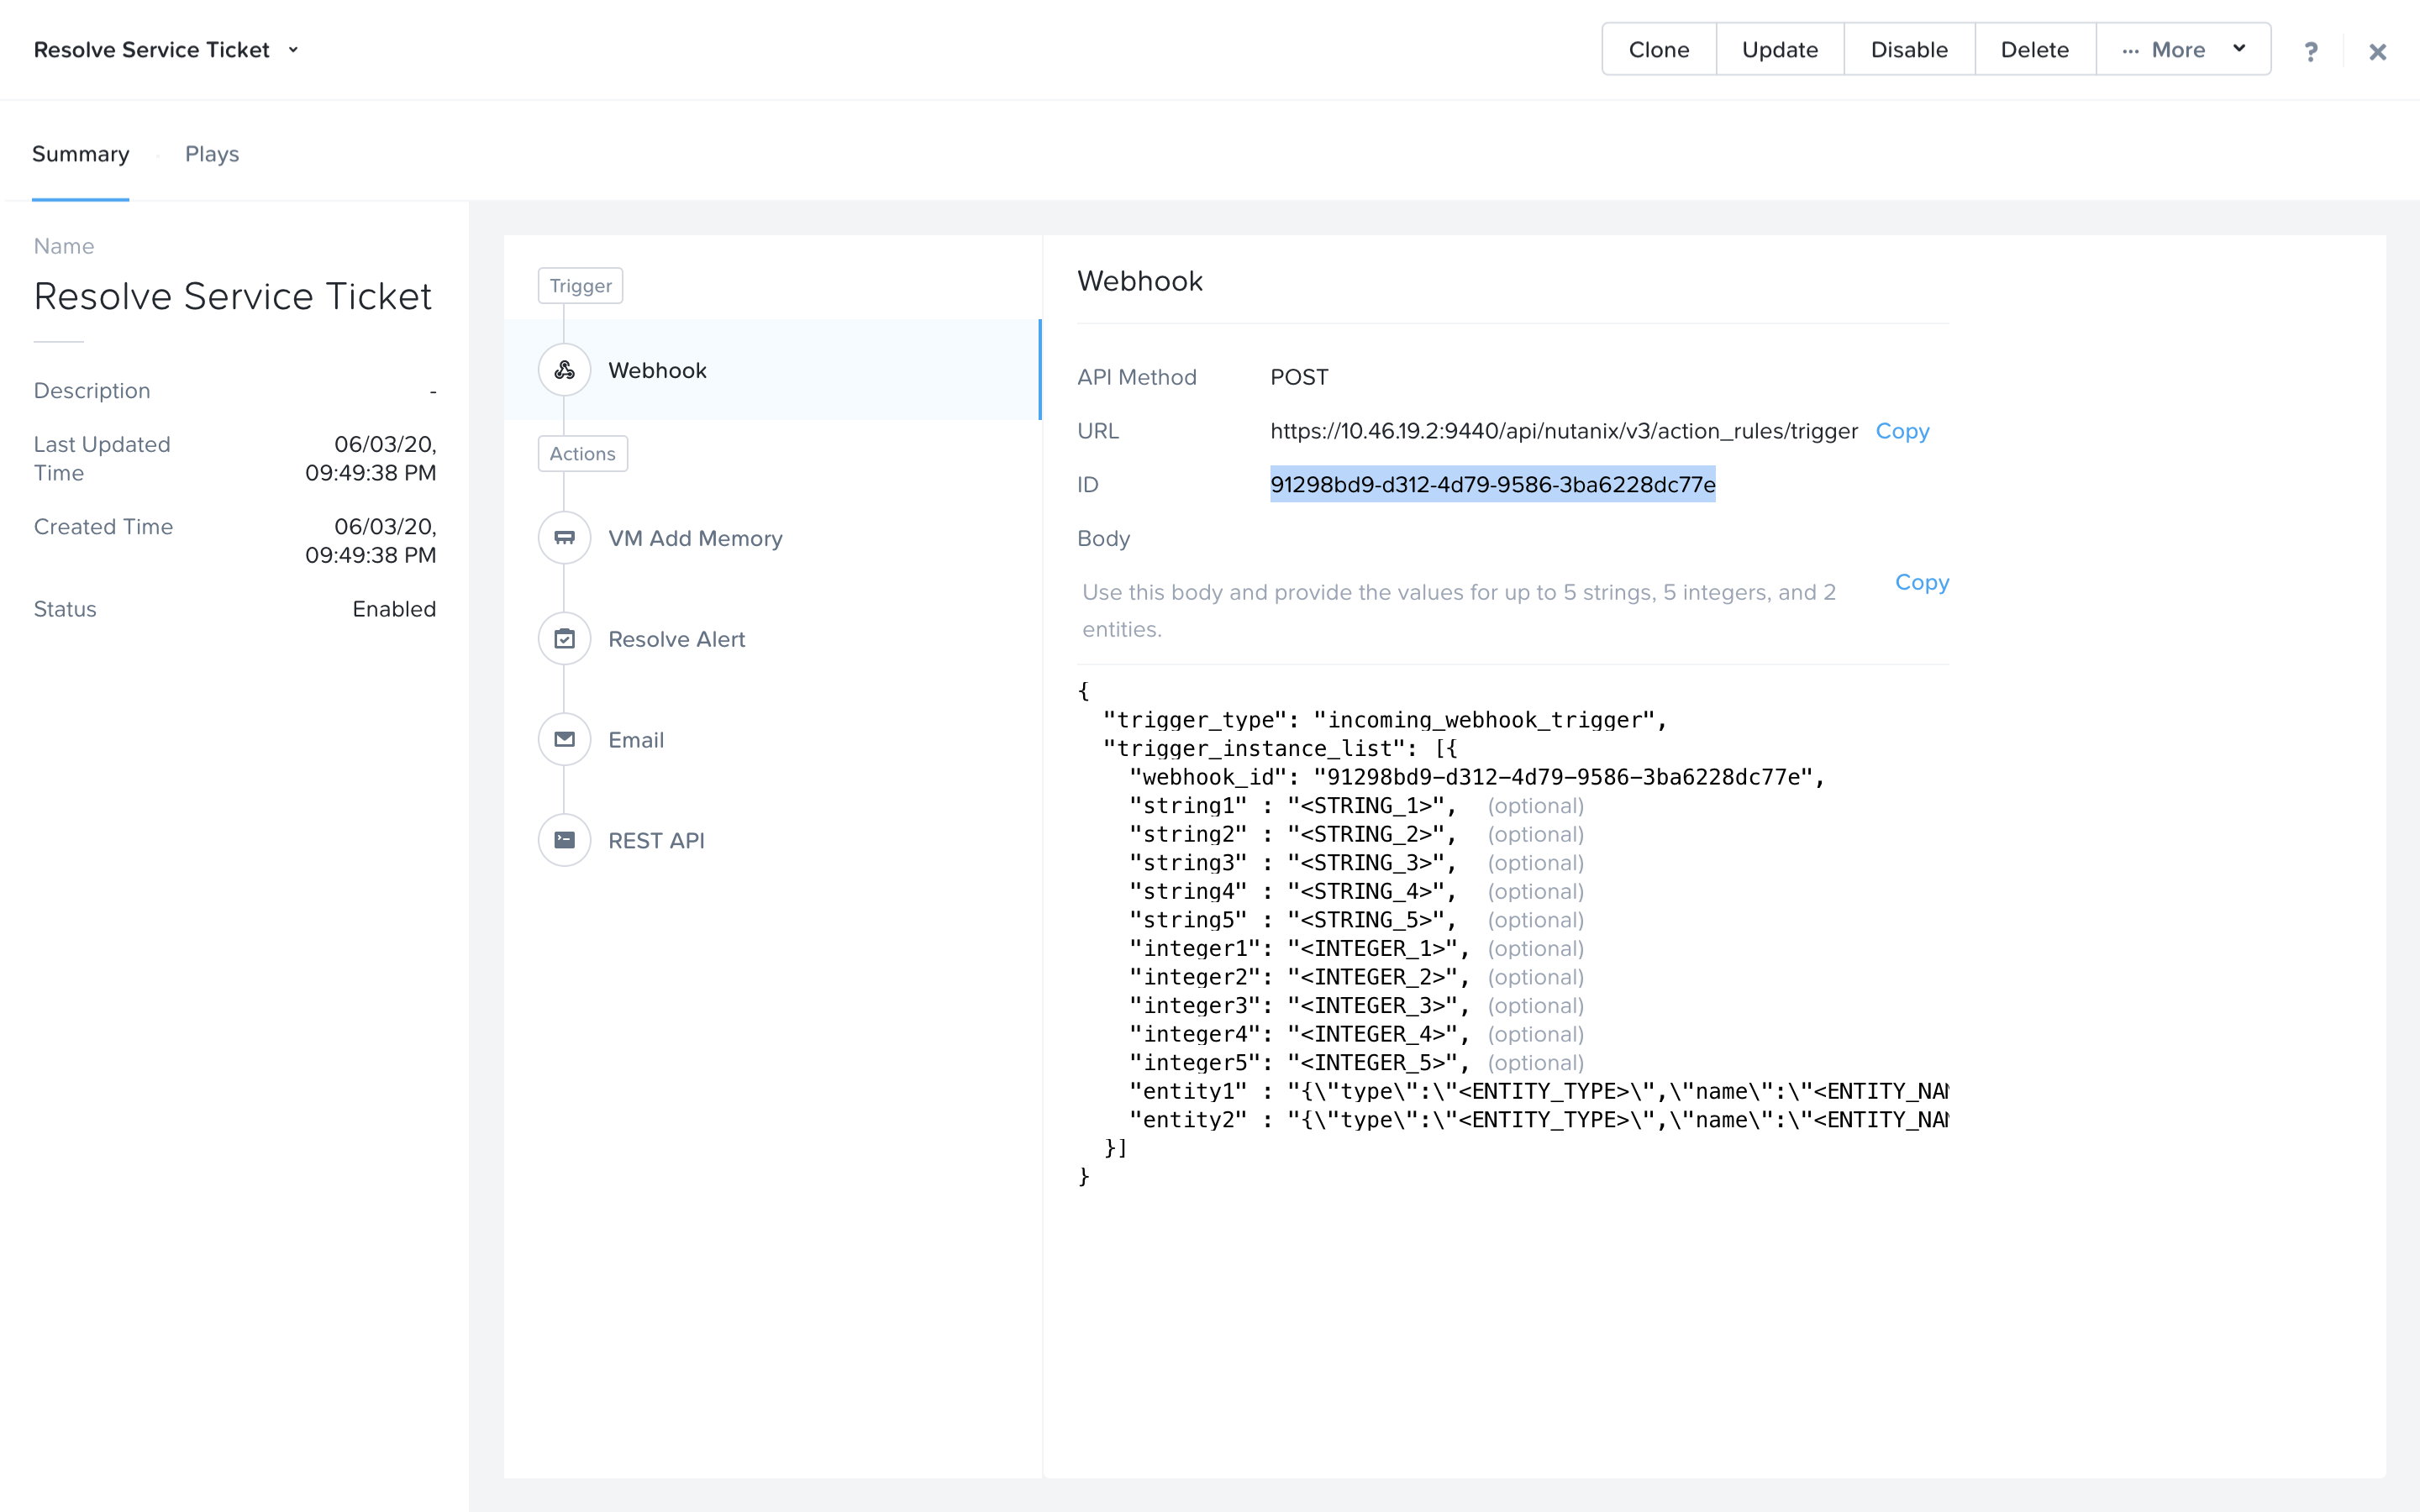
We will need to copy the Webhook ID from the first Playbook we created so that it can be passed in the generate ticket step. Open up your Resolve Service Ticket playbook and copy the Webhook ID to your clipboard.
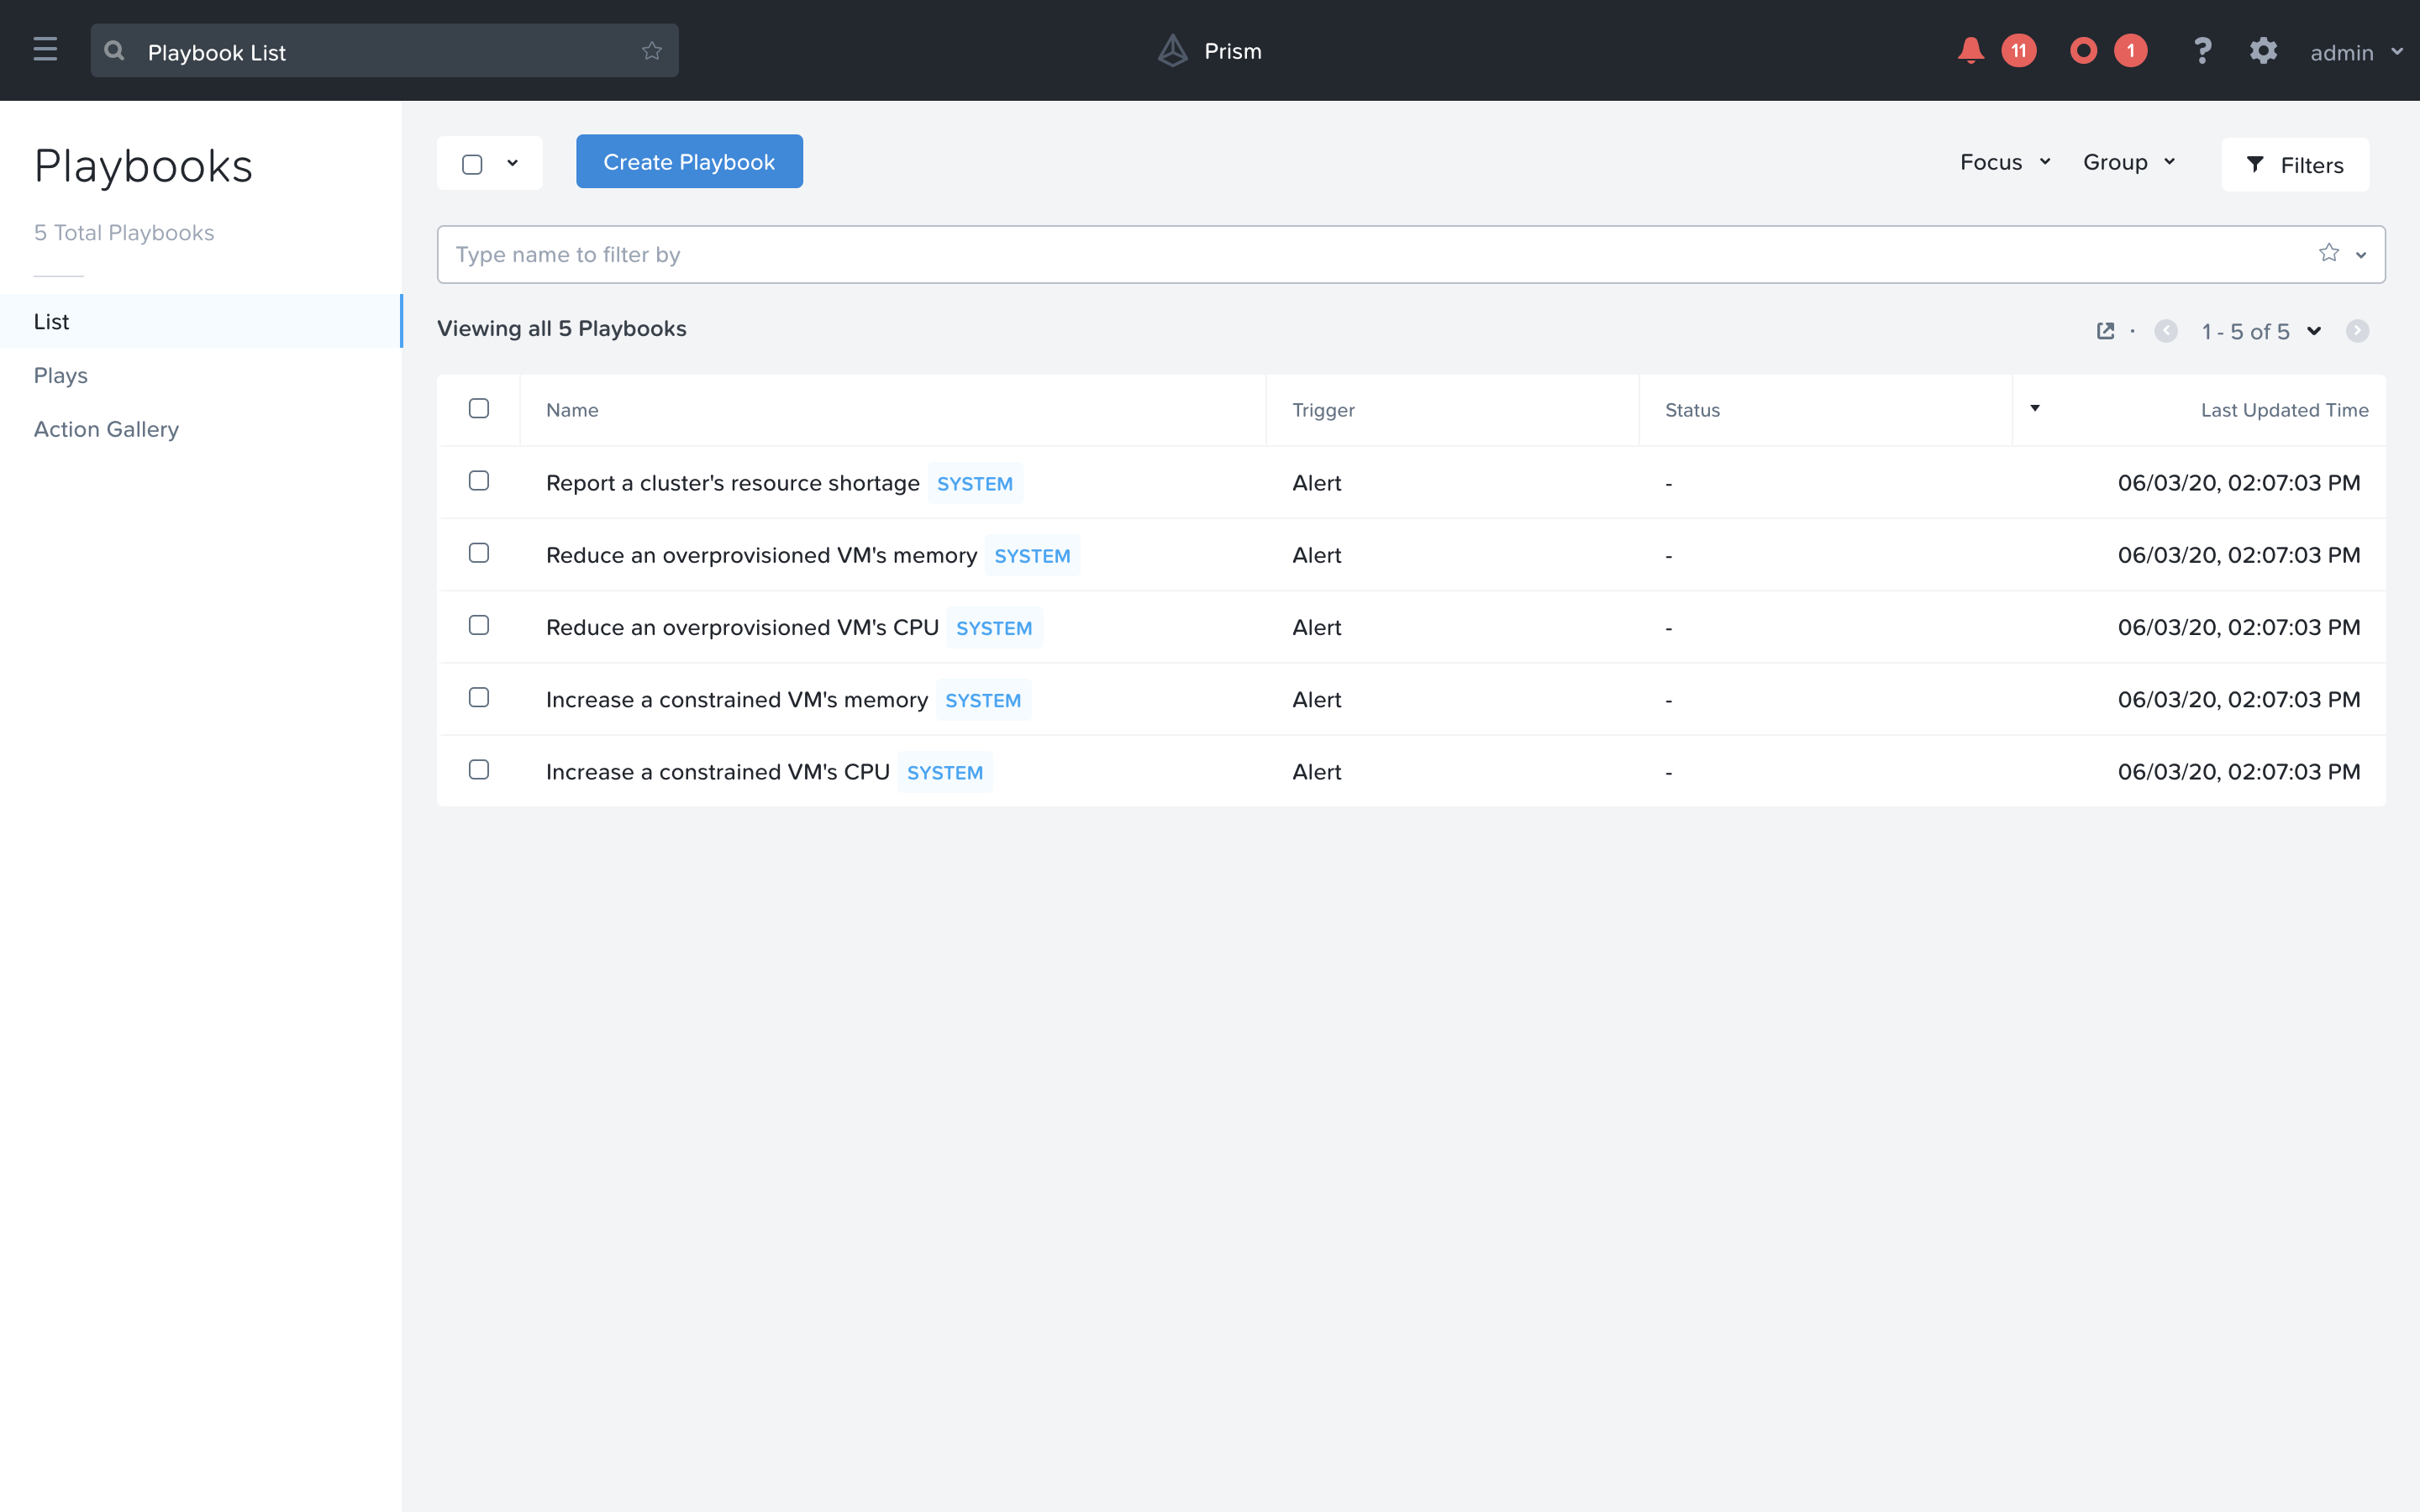
Now we will create a Playbook to automate the generation of a service ticket. Close your Playbook and then click Create Playbook at the top of the table view.
Select Alert as a trigger
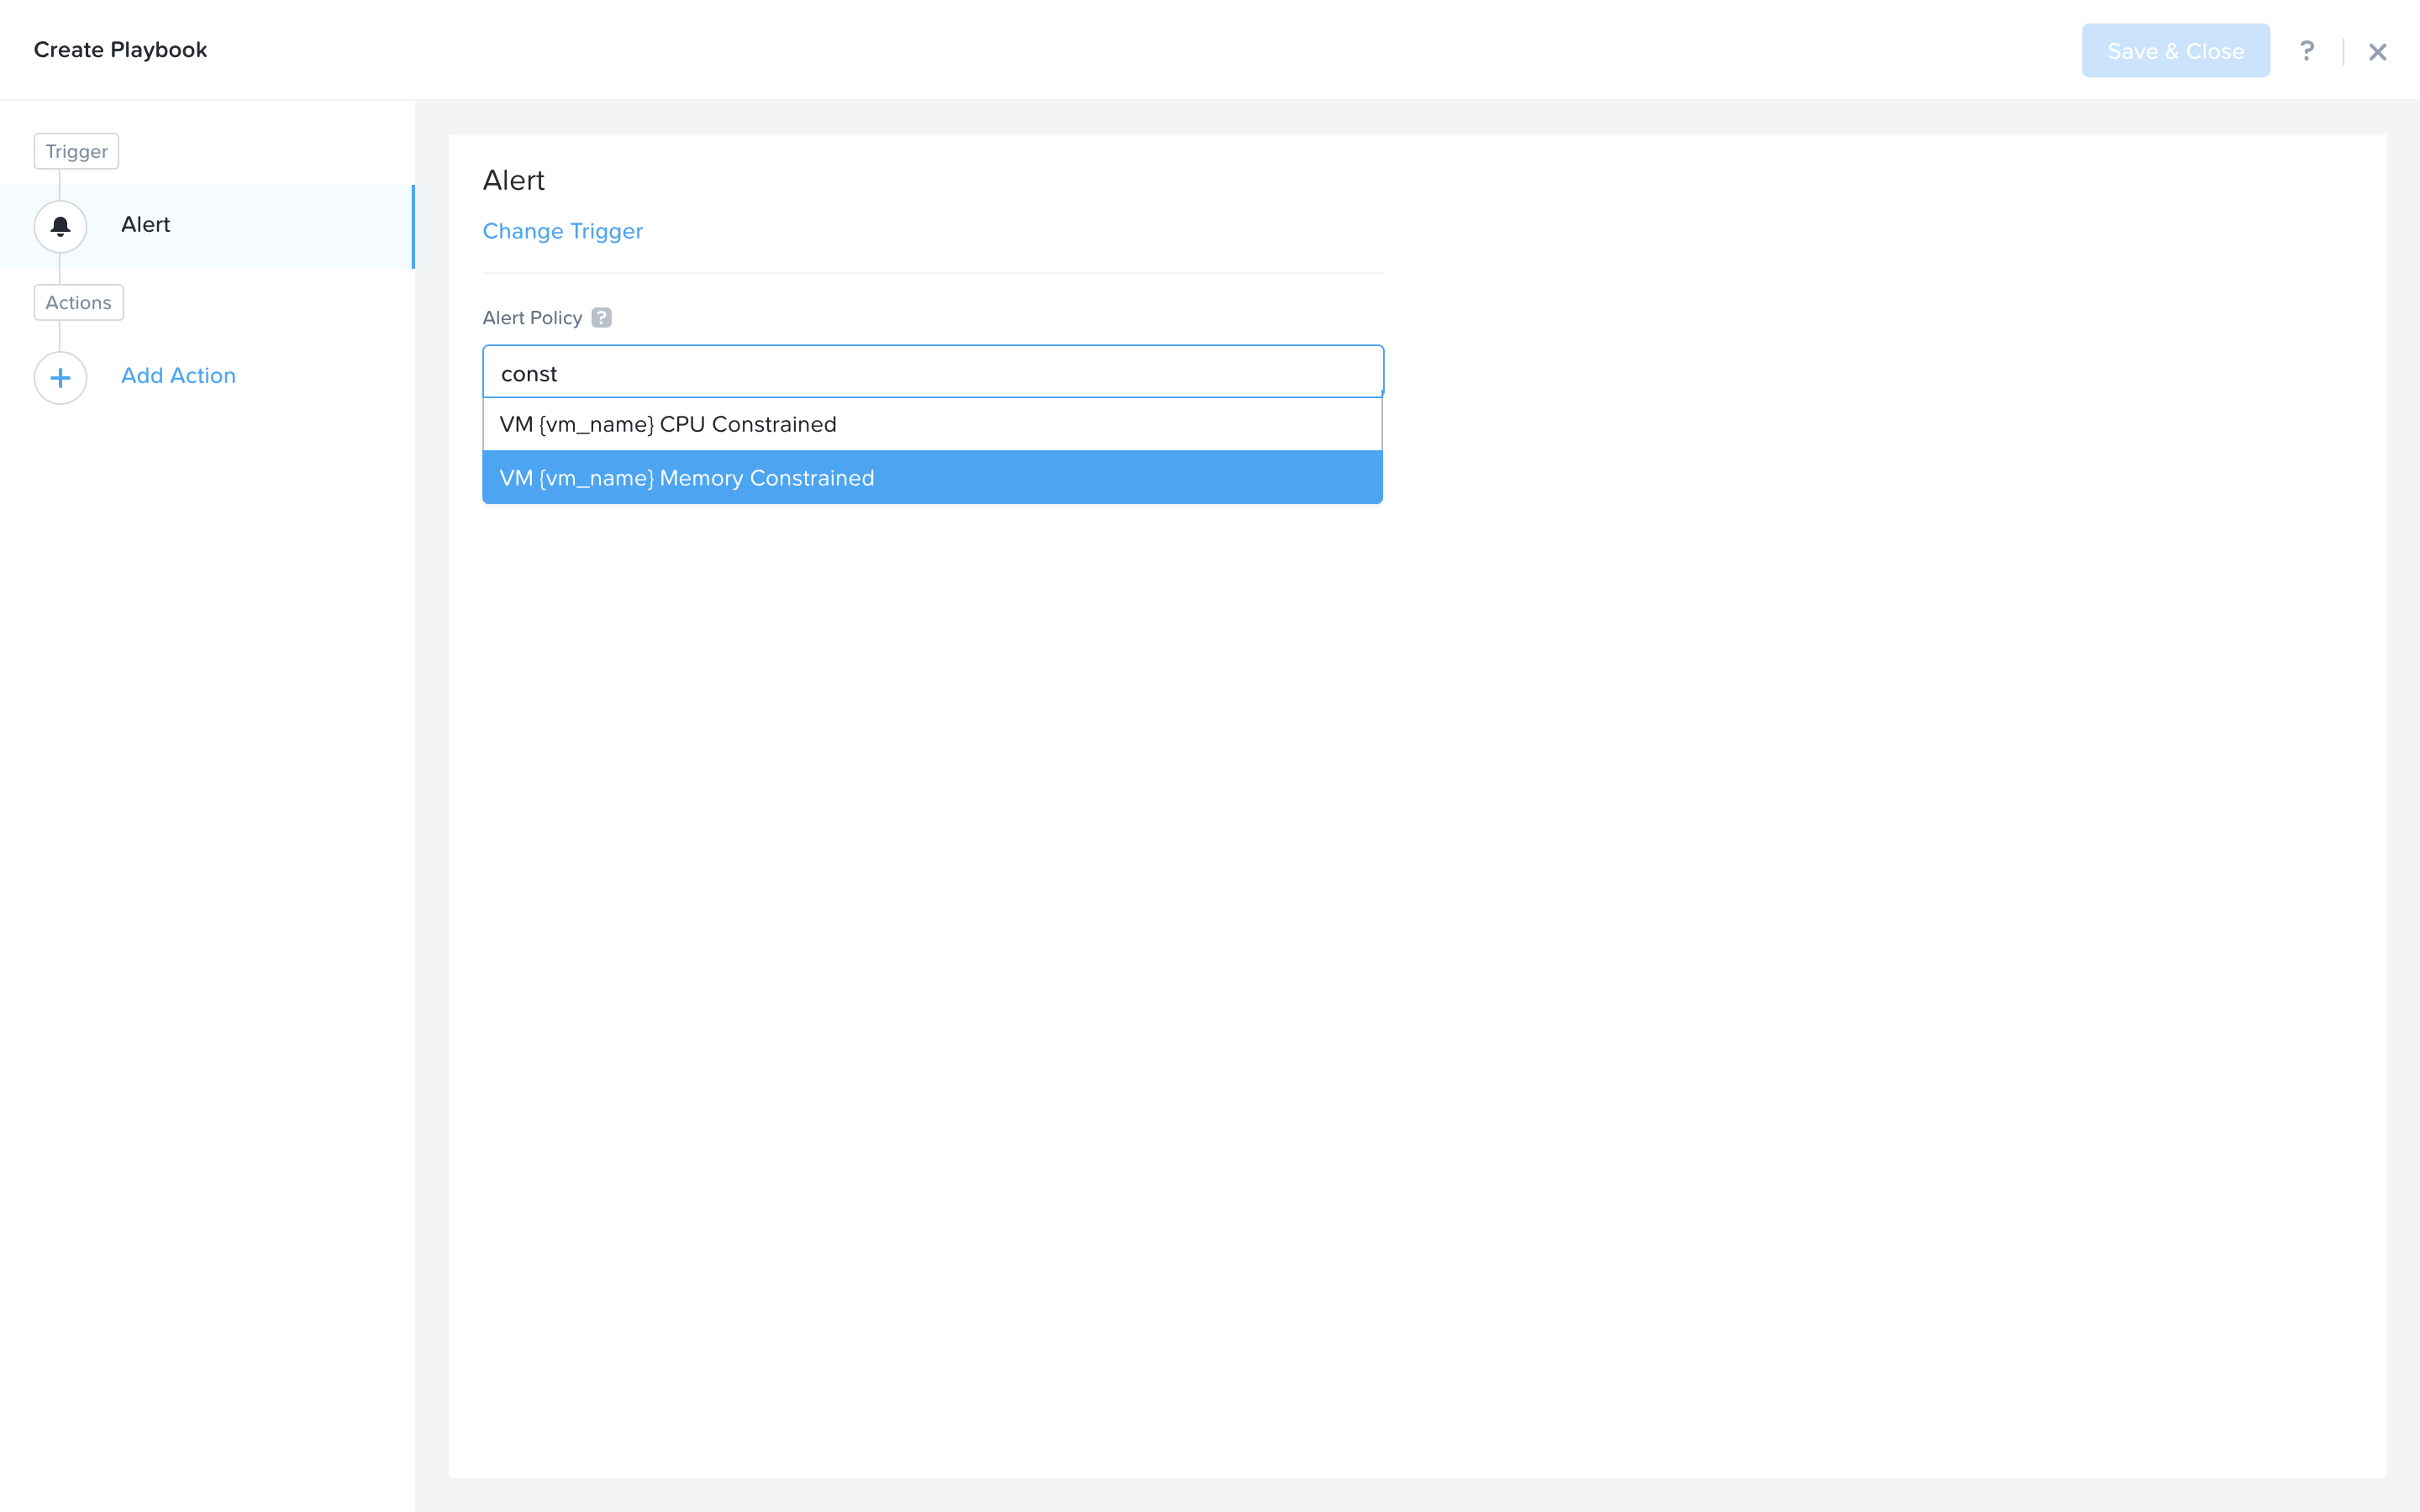
Search and select VM {vm_name} Memory Constrained as the alert policy, since this is the issue we are looking to take automated steps to remediate.
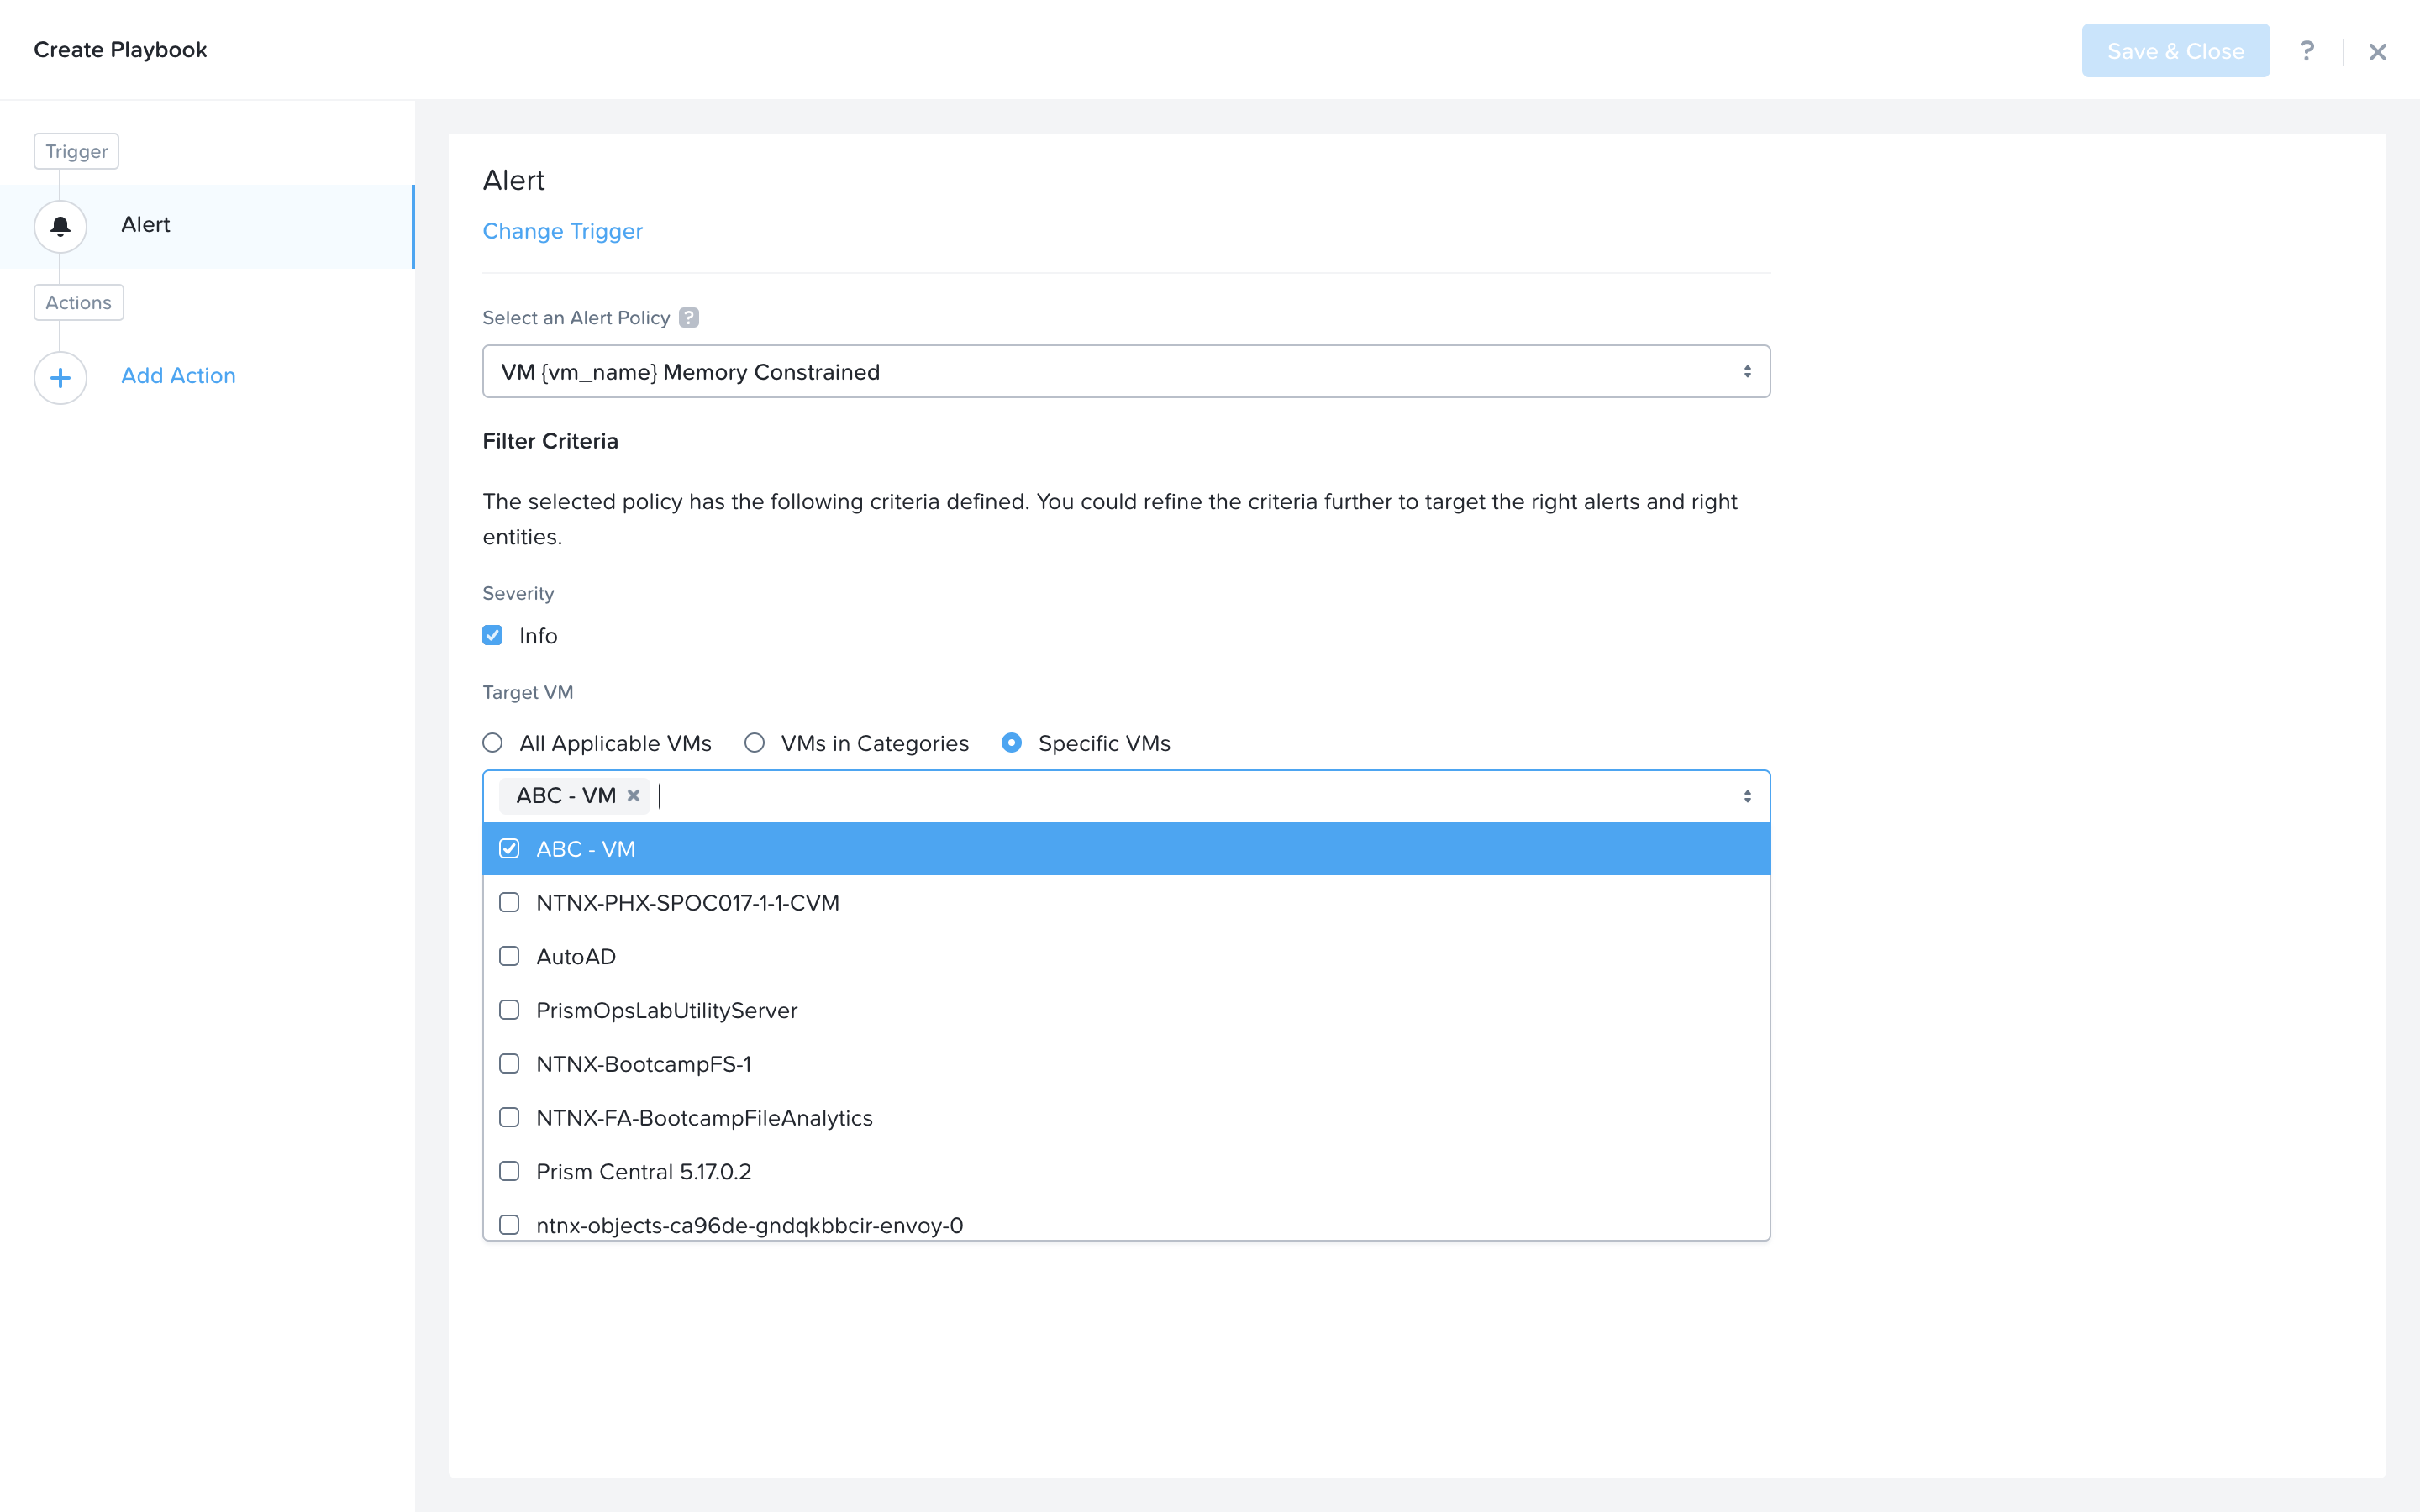
Select the Specify VMs radio button and choose the VM you created for the lab. This will make it so only alerts raised on your VM will trigger this Playbook.
First, we would like to generate a ticket for this alert. Click Add Action on the left side and select the Generate Service Ticket action you created. Notice the details from the Generate Service Ticket Action you created are automatically filled in for you. Go ahead and replace the <ENTER_ID_HERE> text with the Webhook ID you copied to your clipboard.
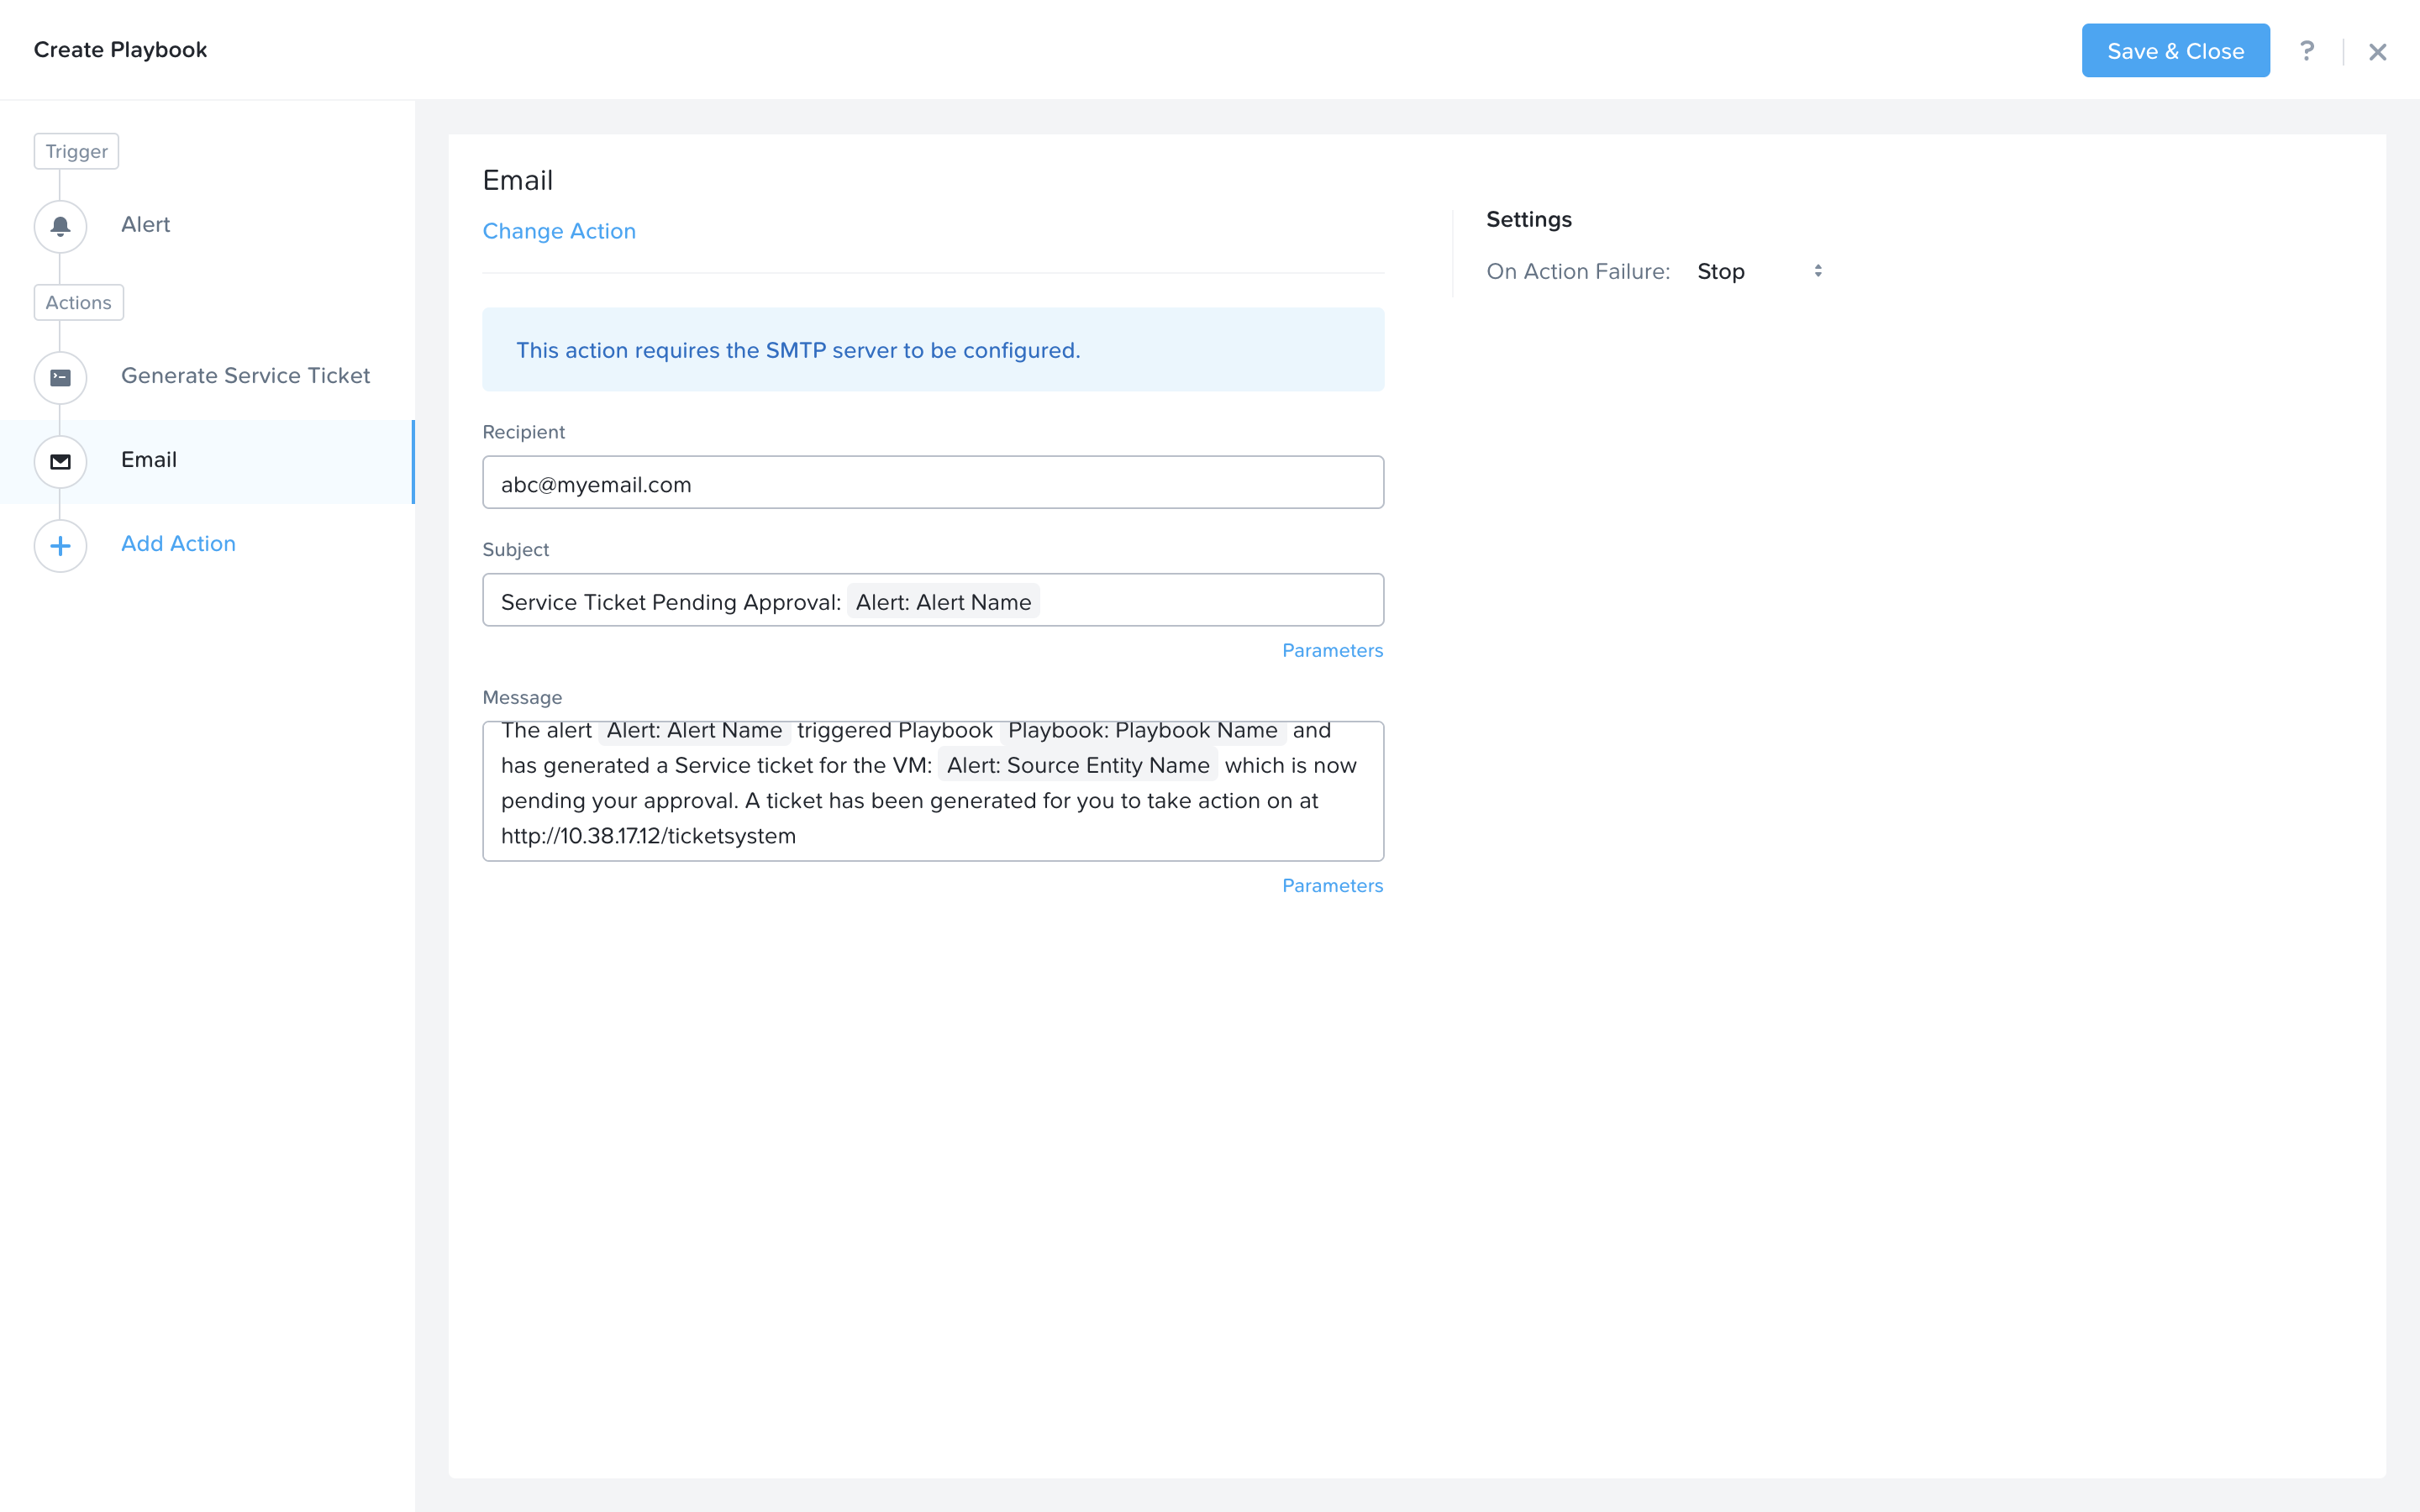
Next we would like to notify someone that the ticket was created by X-Play. Click Add Action and select the Email action. Fill in the field in the email action. Here are the examples. Be sure to replace <PrismOpsLabUtilityServer_IP_ADDRESS> in the message with it’s IP Address.
Recipient: - Fill in your email address.
Subject : -
Service Ticket Pending Approval: {{trigger[0].alert_entity_info.name}}Message: -
The alert {{trigger[0].alert_entity_info.name}} triggered Playbook {{playbook.playbook_name}} and has generated a Service ticket for the VM: {{trigger[0].source_entity_info.name}} which is now pending your approval. A ticket has been generated for you to take action on at http://<PrismOpsLabUtilityServer_IP_ADDRESS>/ticketsystem
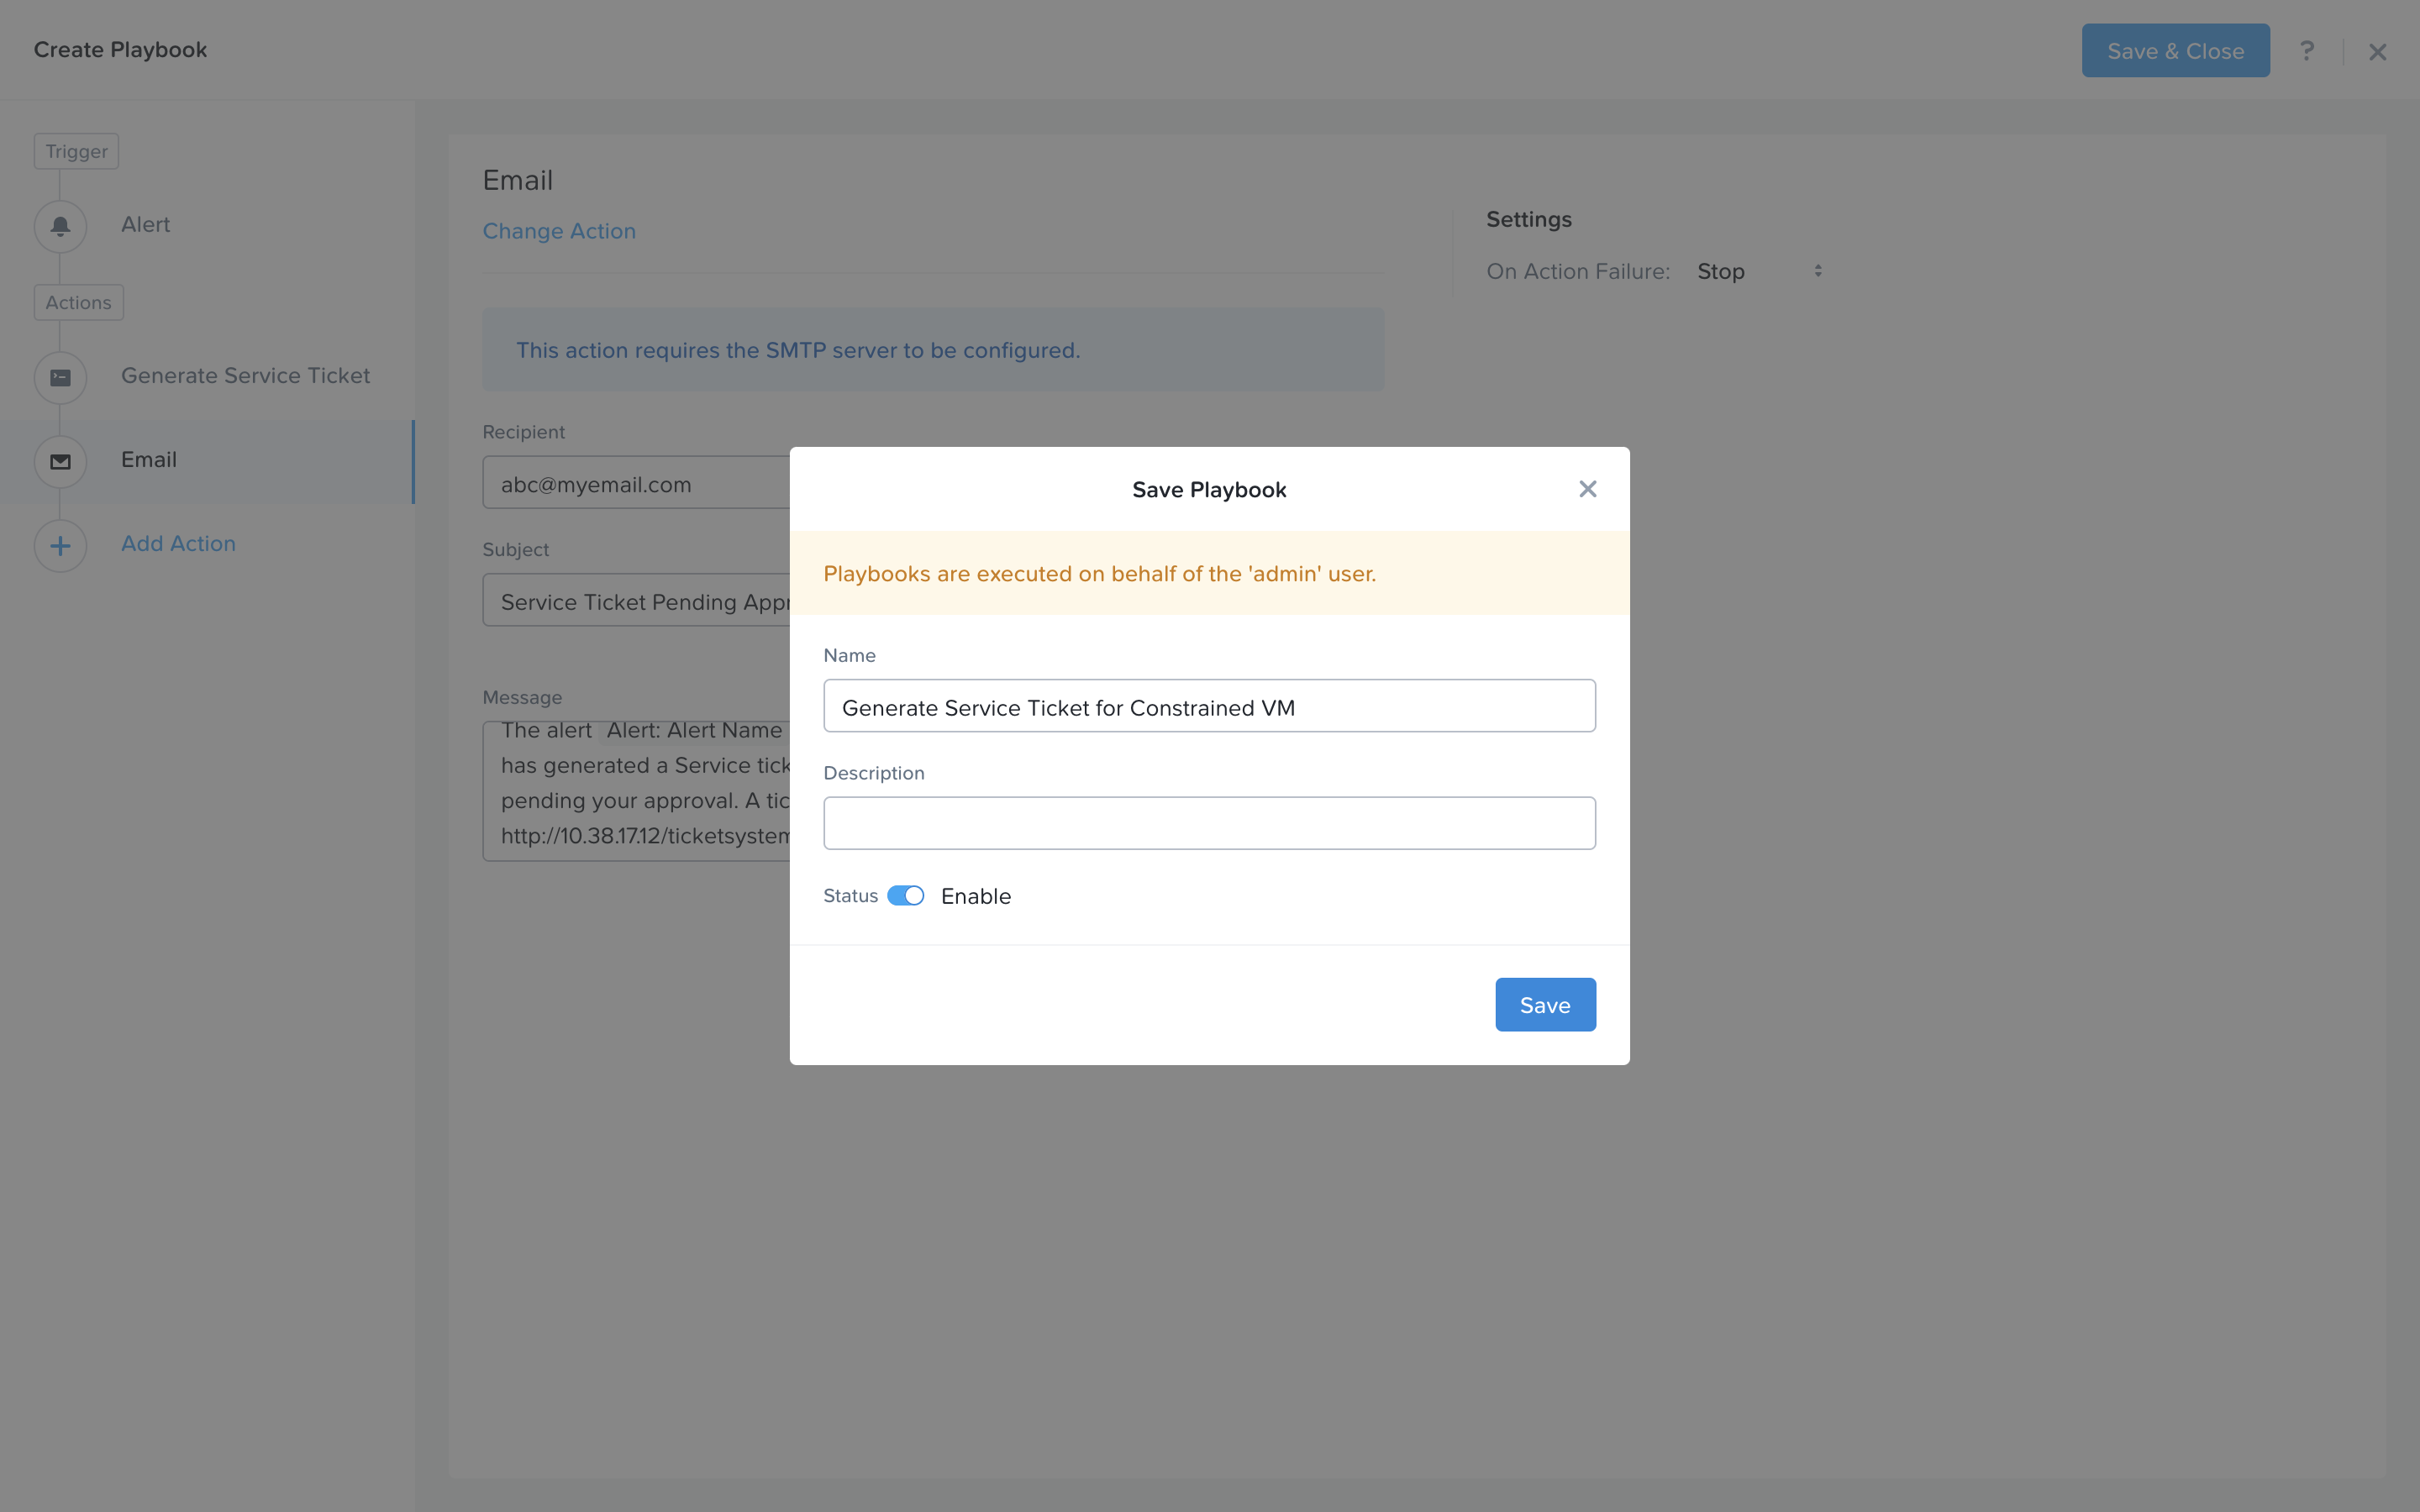
Click Save & Close button and save it with a name “Initials - Generate Service Ticket for Constrained VM”. Be sure to enable the ‘Enabled’ toggle.
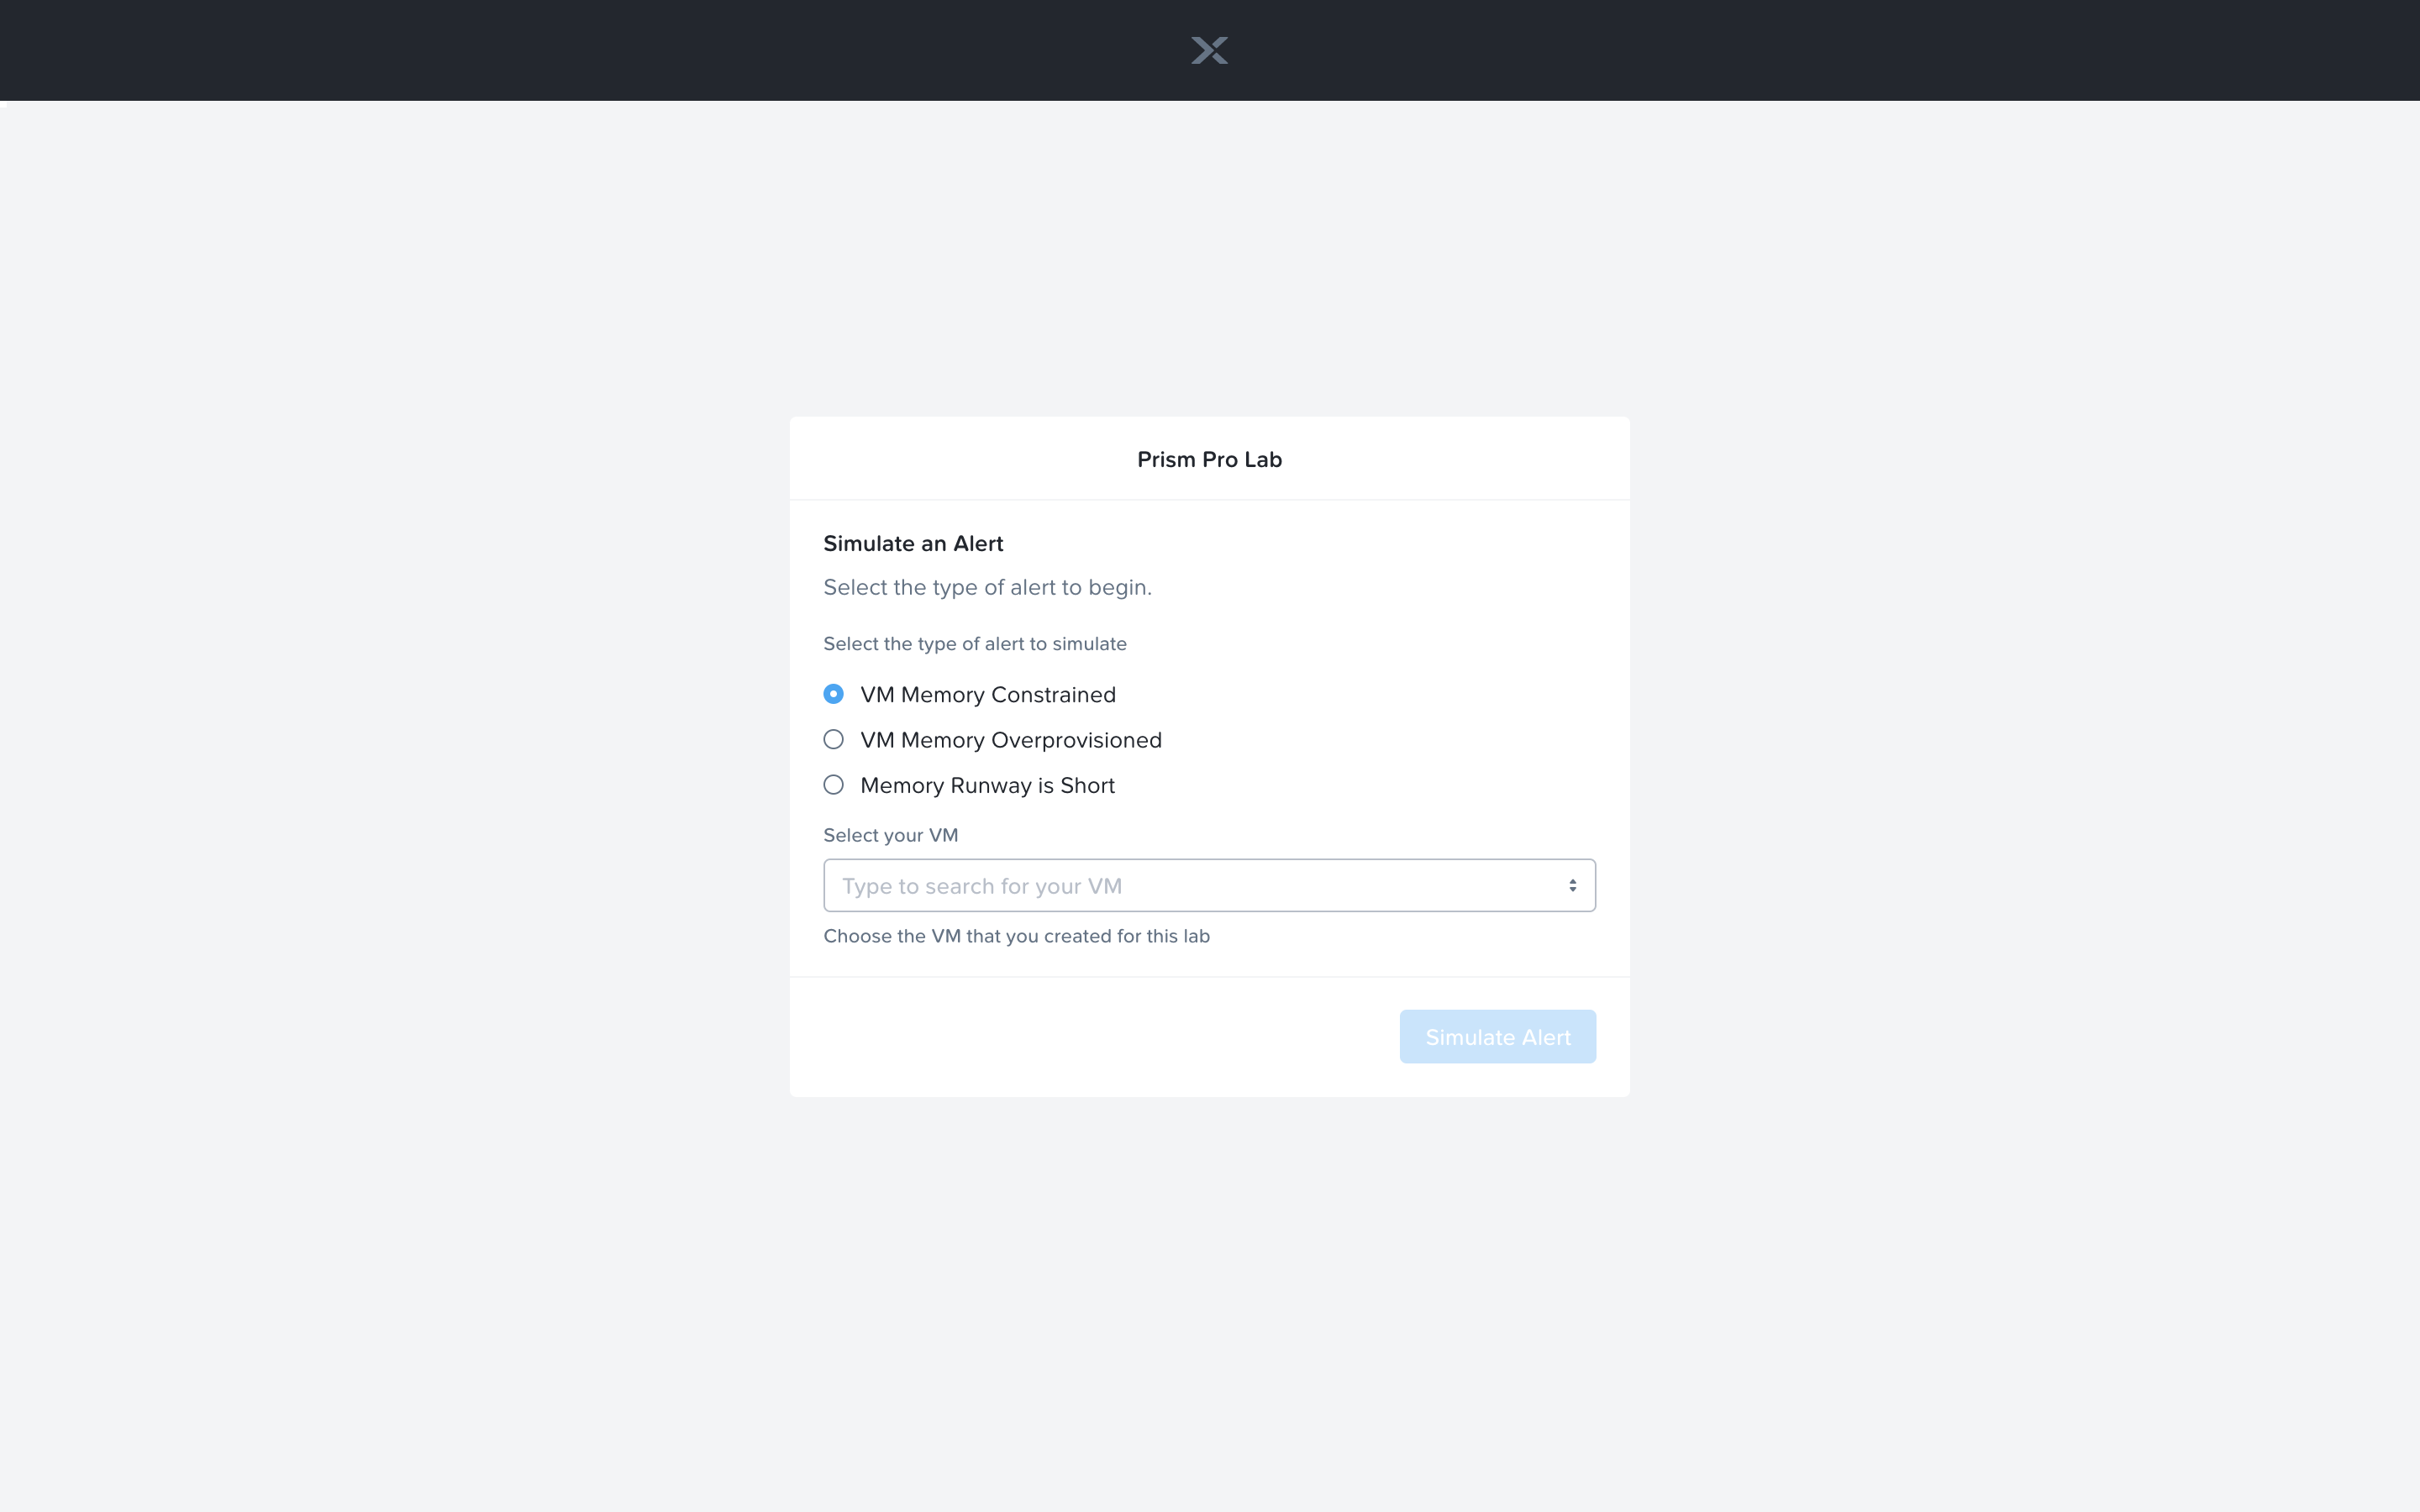
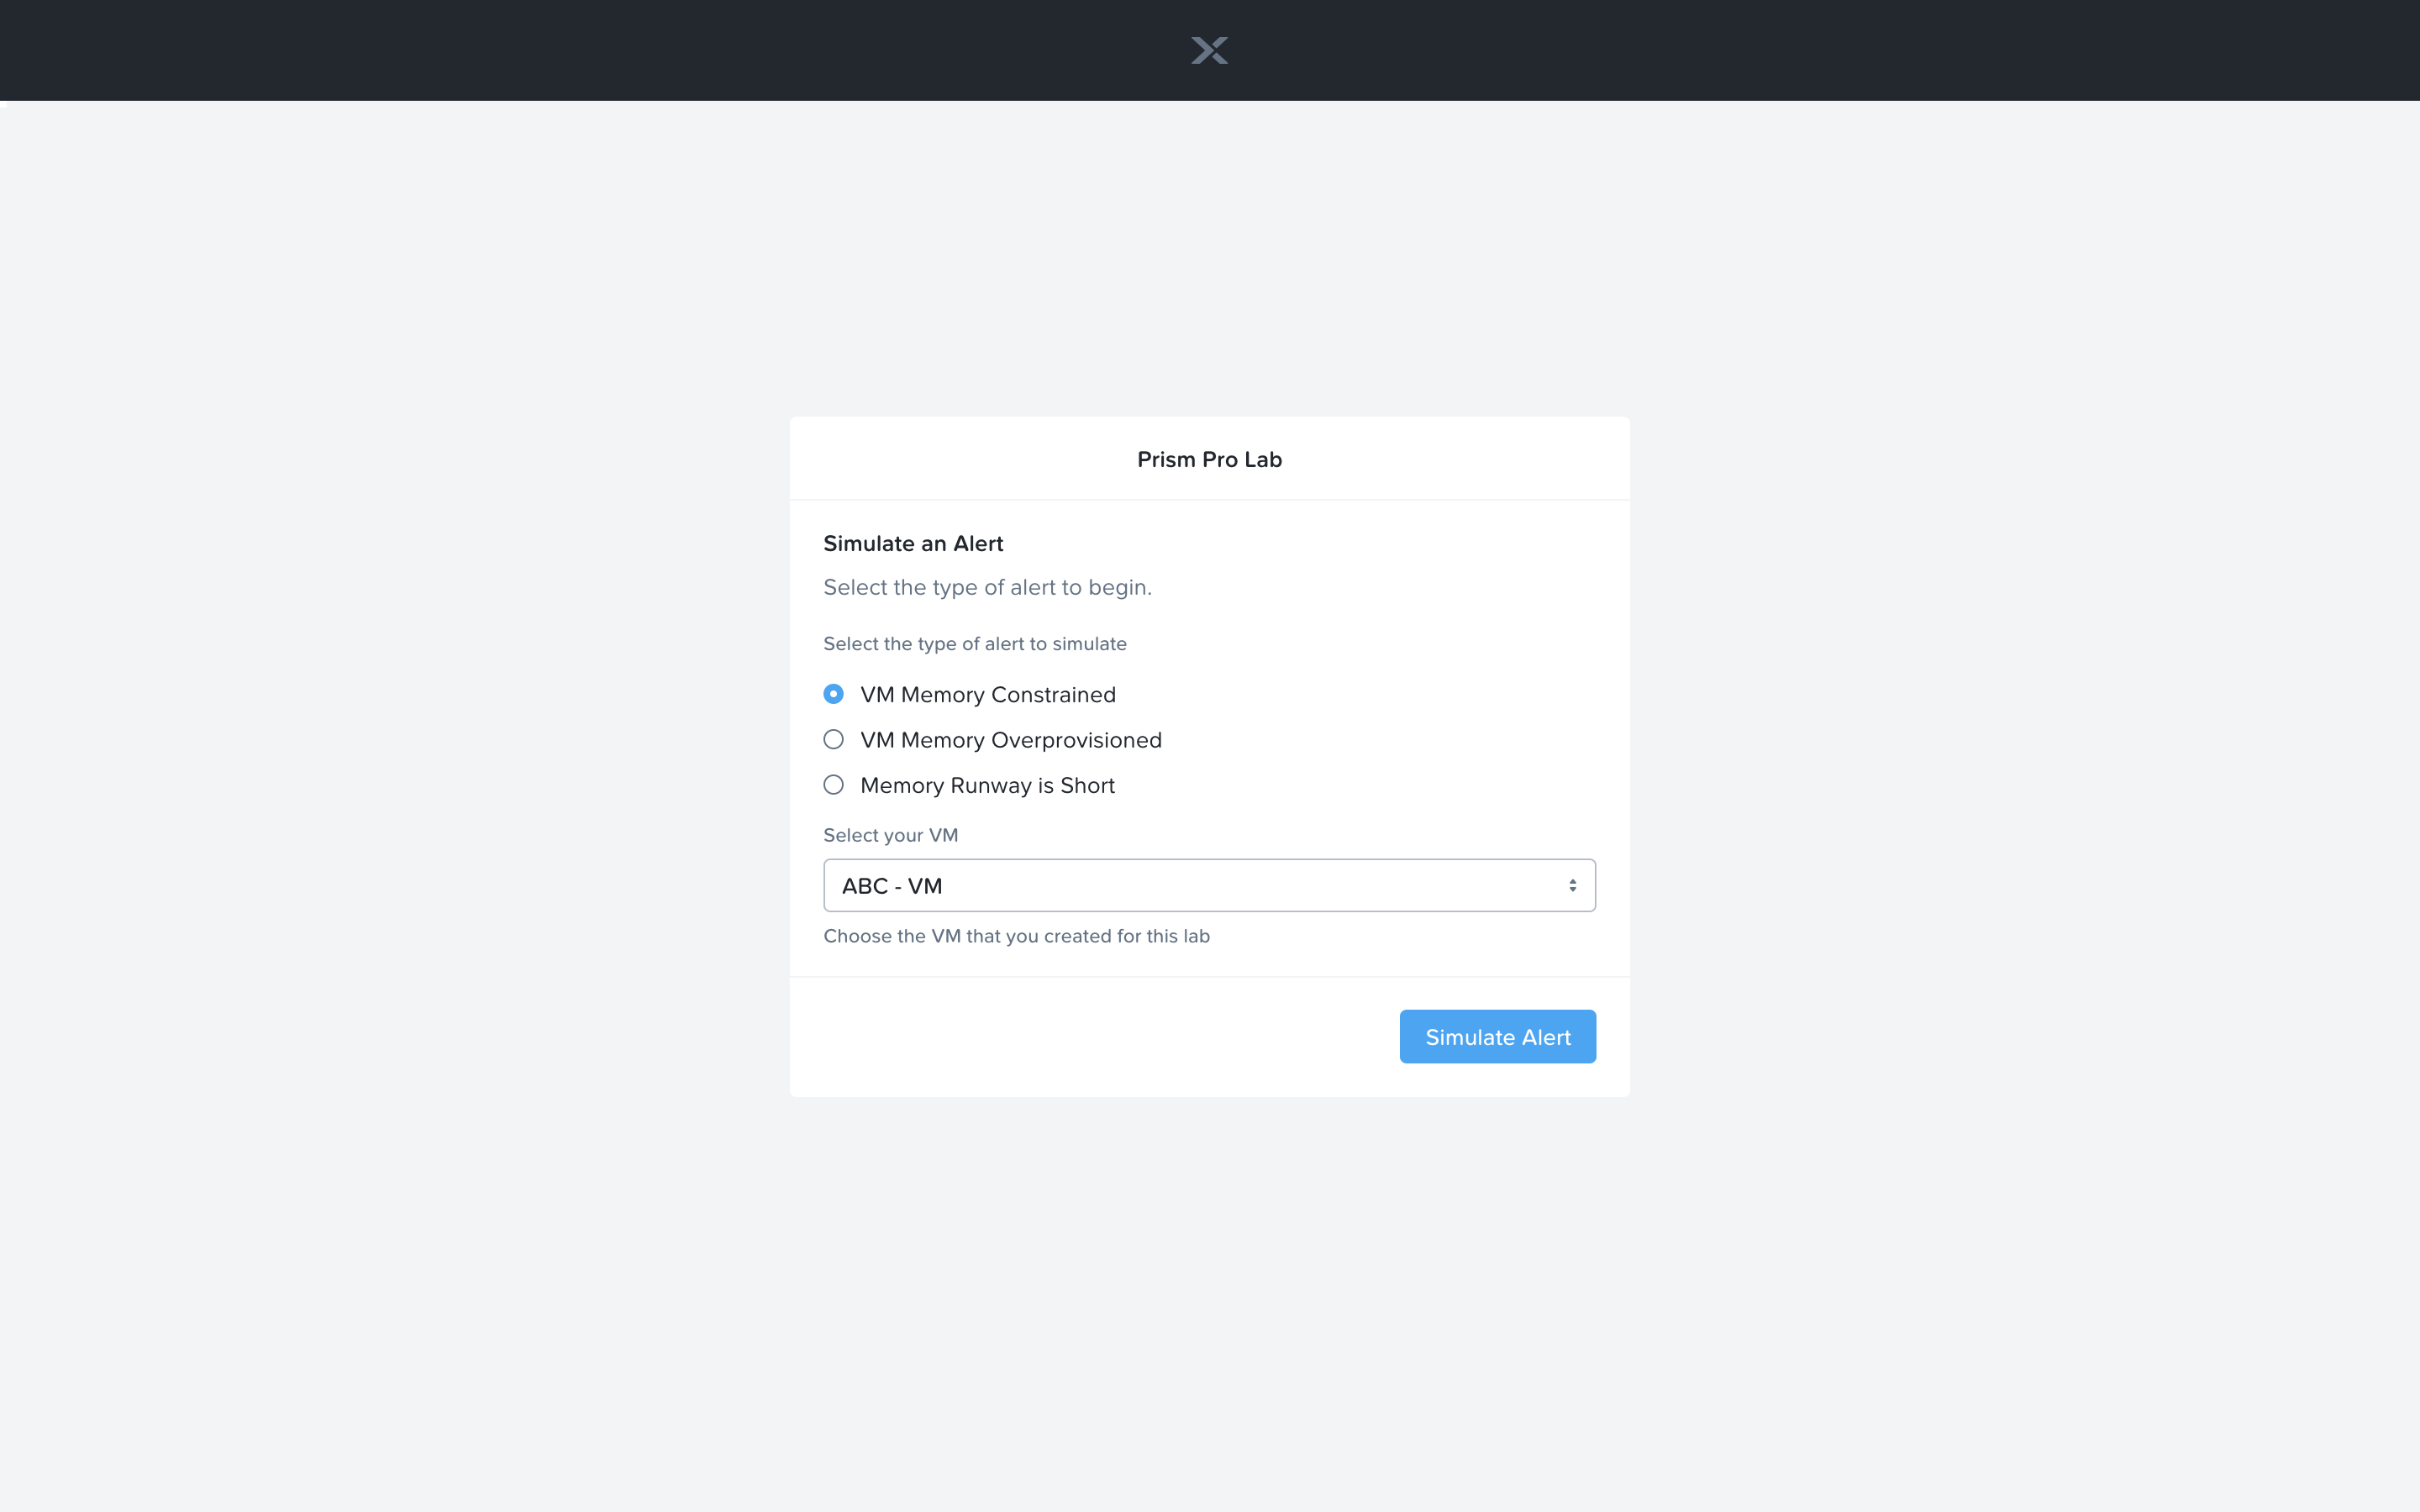
Now let’s trigger the workflow. Navigate to the tab you opened in the setup with the /alerts URL [example 10.38.17.12/alerts]. Select the Radio for VM Memory Constrained and input your VM. Click the Simulate Alert button. This will simulate a memory constrained alert on your VM.
You should recieve an email to the email address you put down in the first playbook. It may take up to 5 minutes.
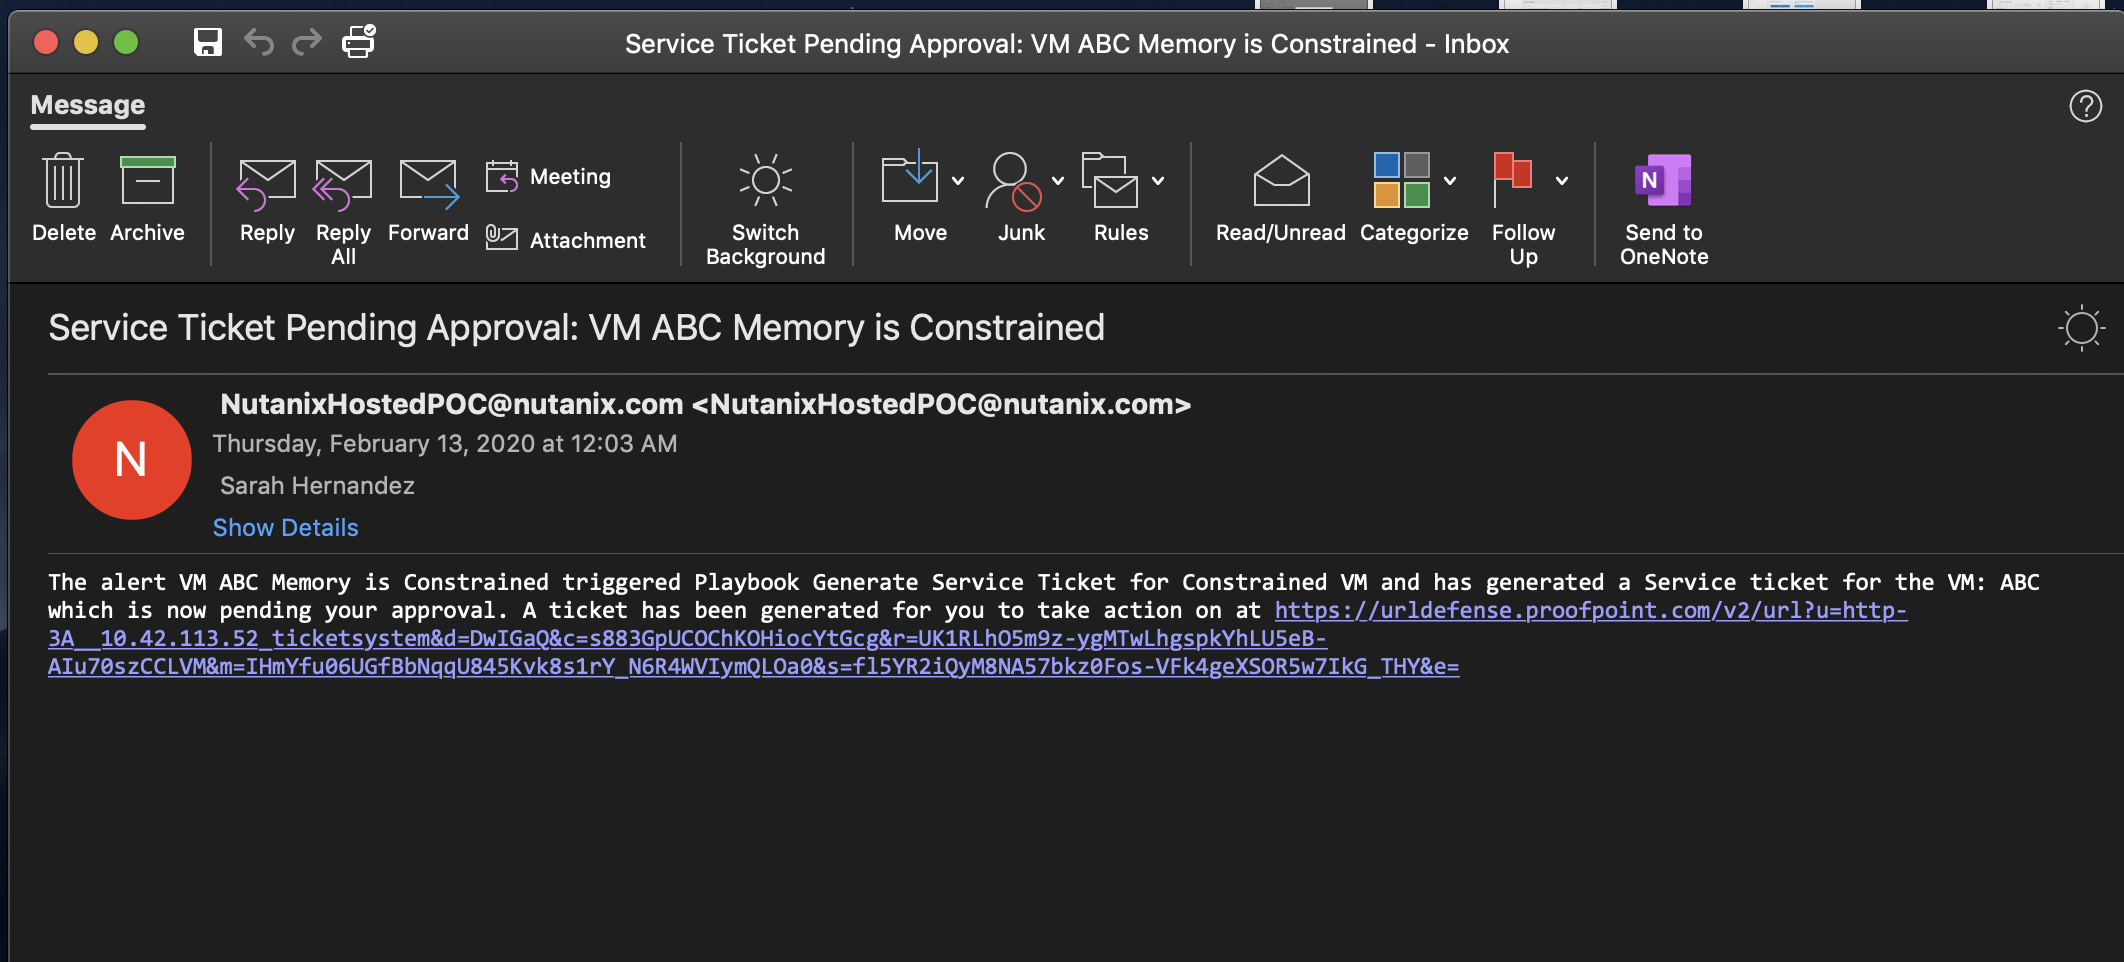
Inside the email click the link to visit the ticket system. Alternatively you can directly access the ticket system by navigating to http://<PrismOpsLabUtilityServer_IP_ADDRESS>/ticketsystem from a new tab in your browser.
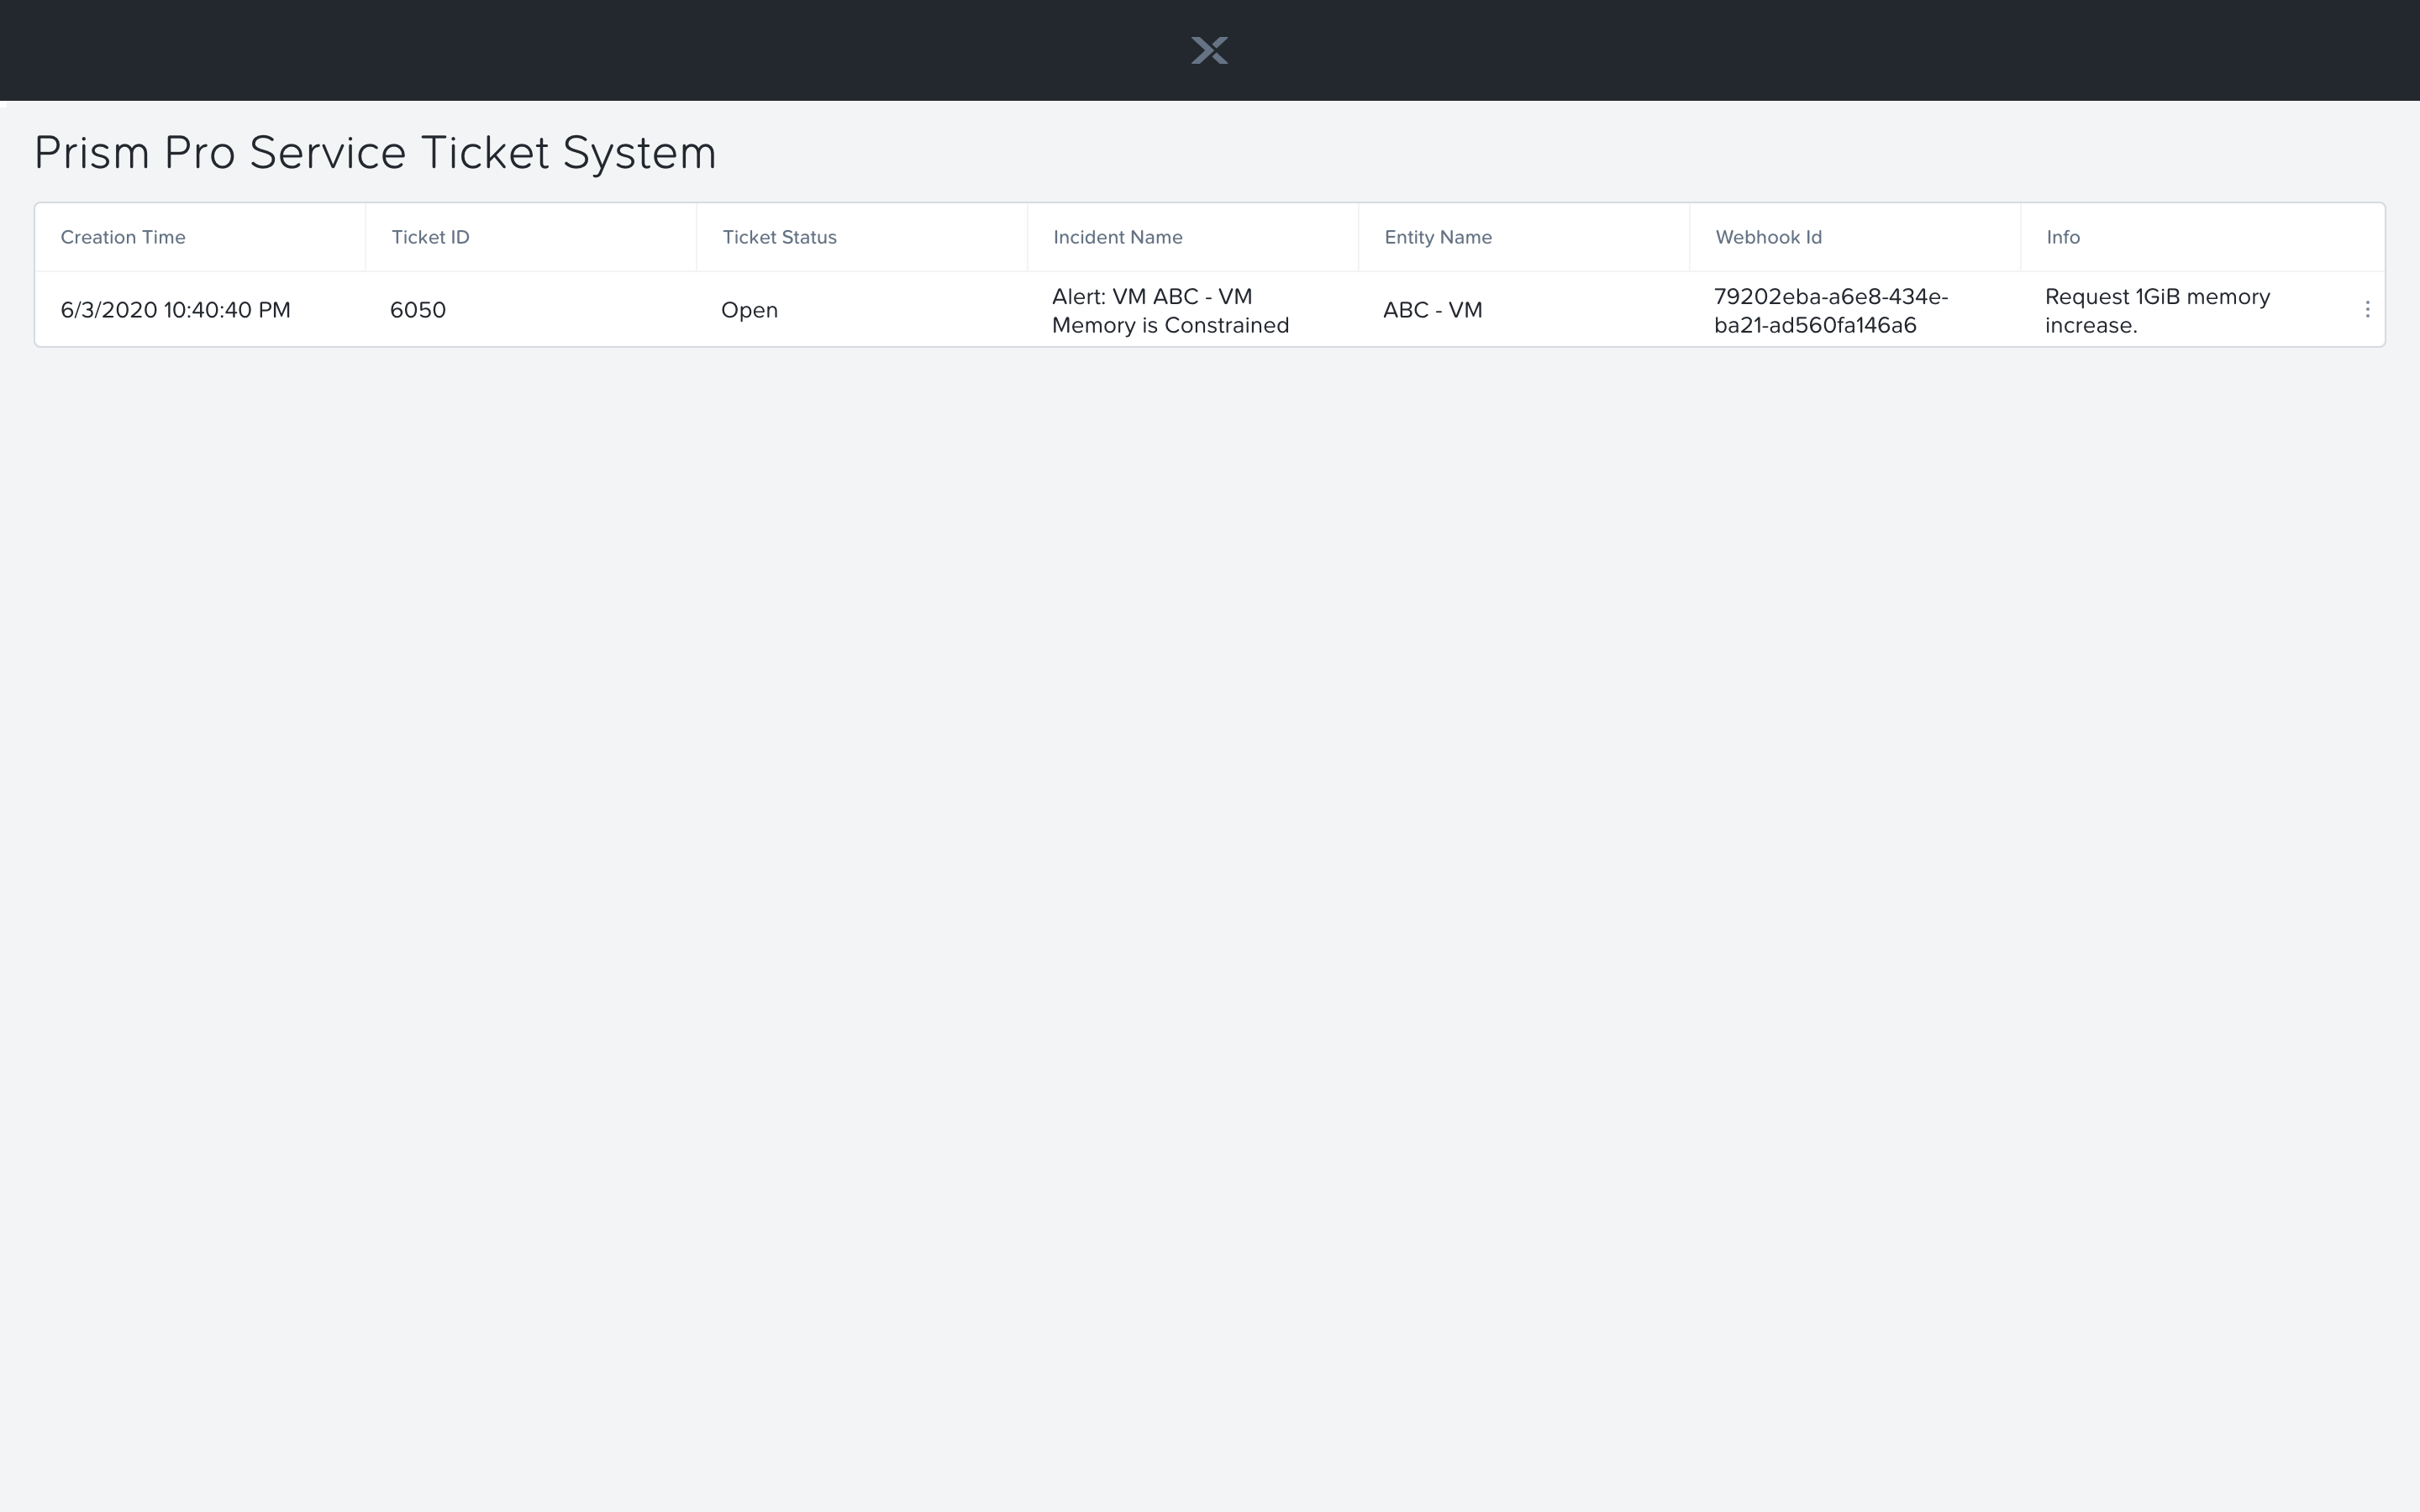
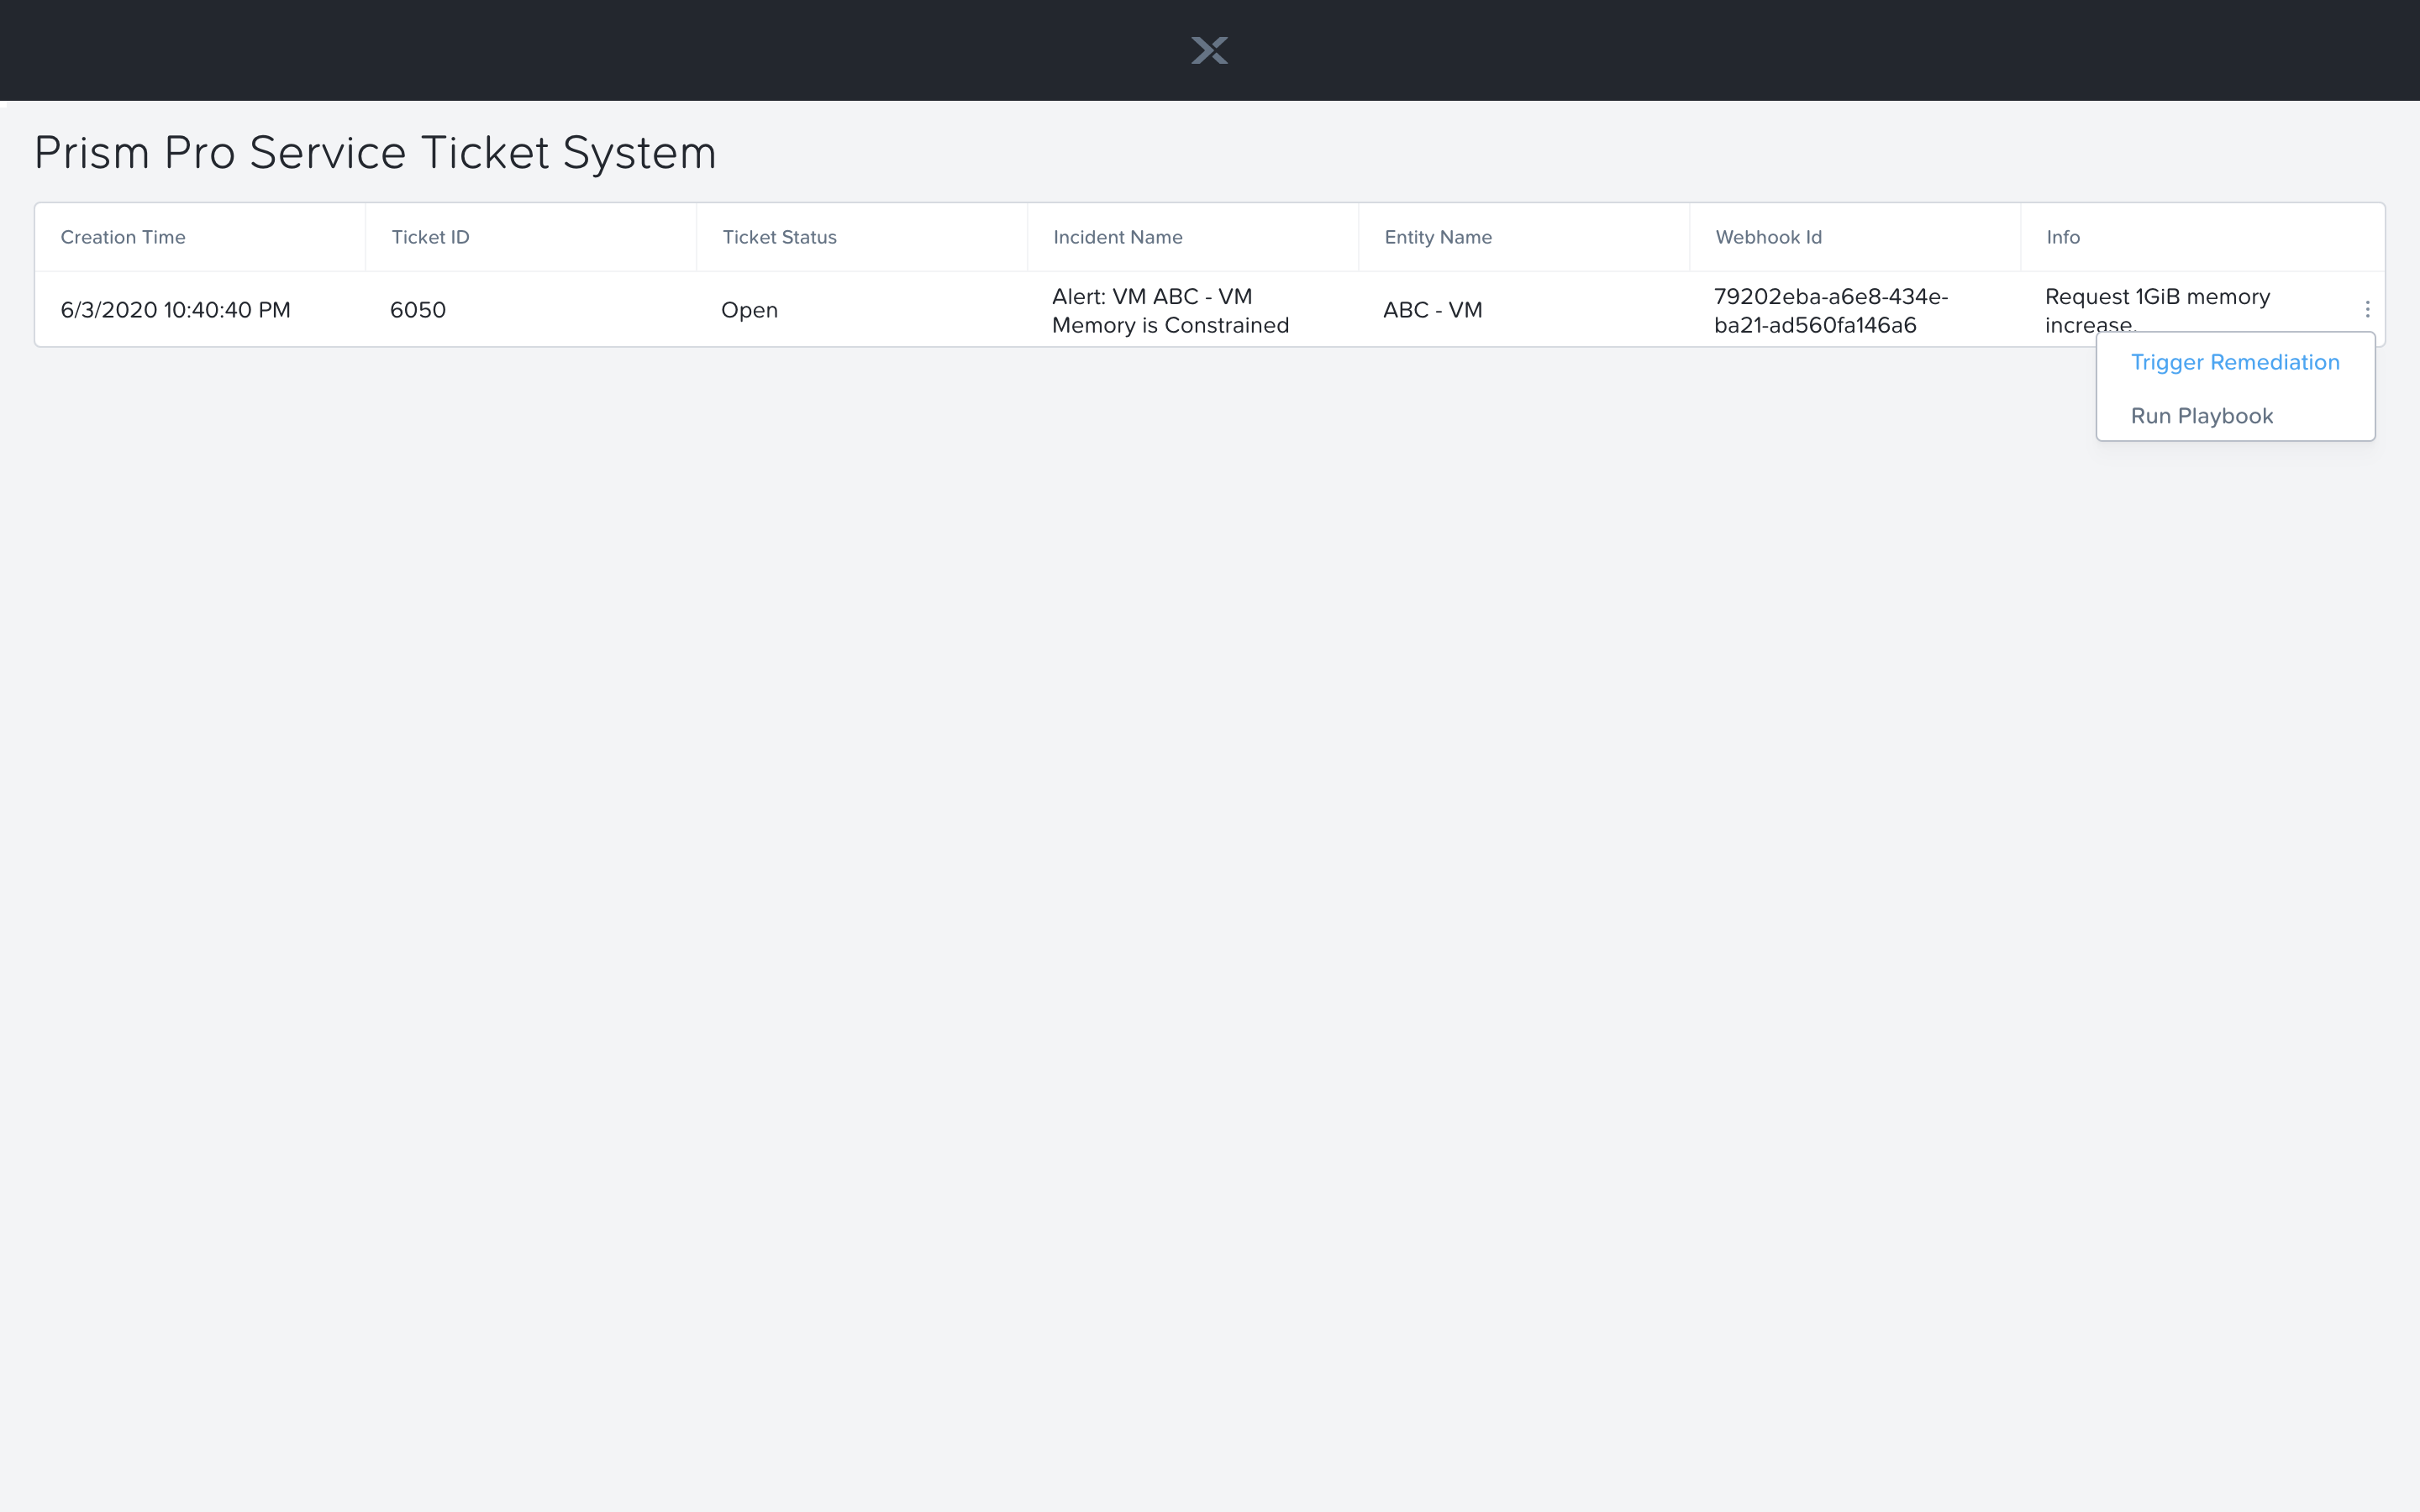
Identify the ticket created for your VM, and click the vertical dots icon to show the Action menu. Click the Trigger Remediation option. This will call the Webhook that was passed in the REST API to generate the service ticket, which will trigger the Resolve Service Ticket Playbook. It will pass on the information for the VM and Alert that triggered the workflow.
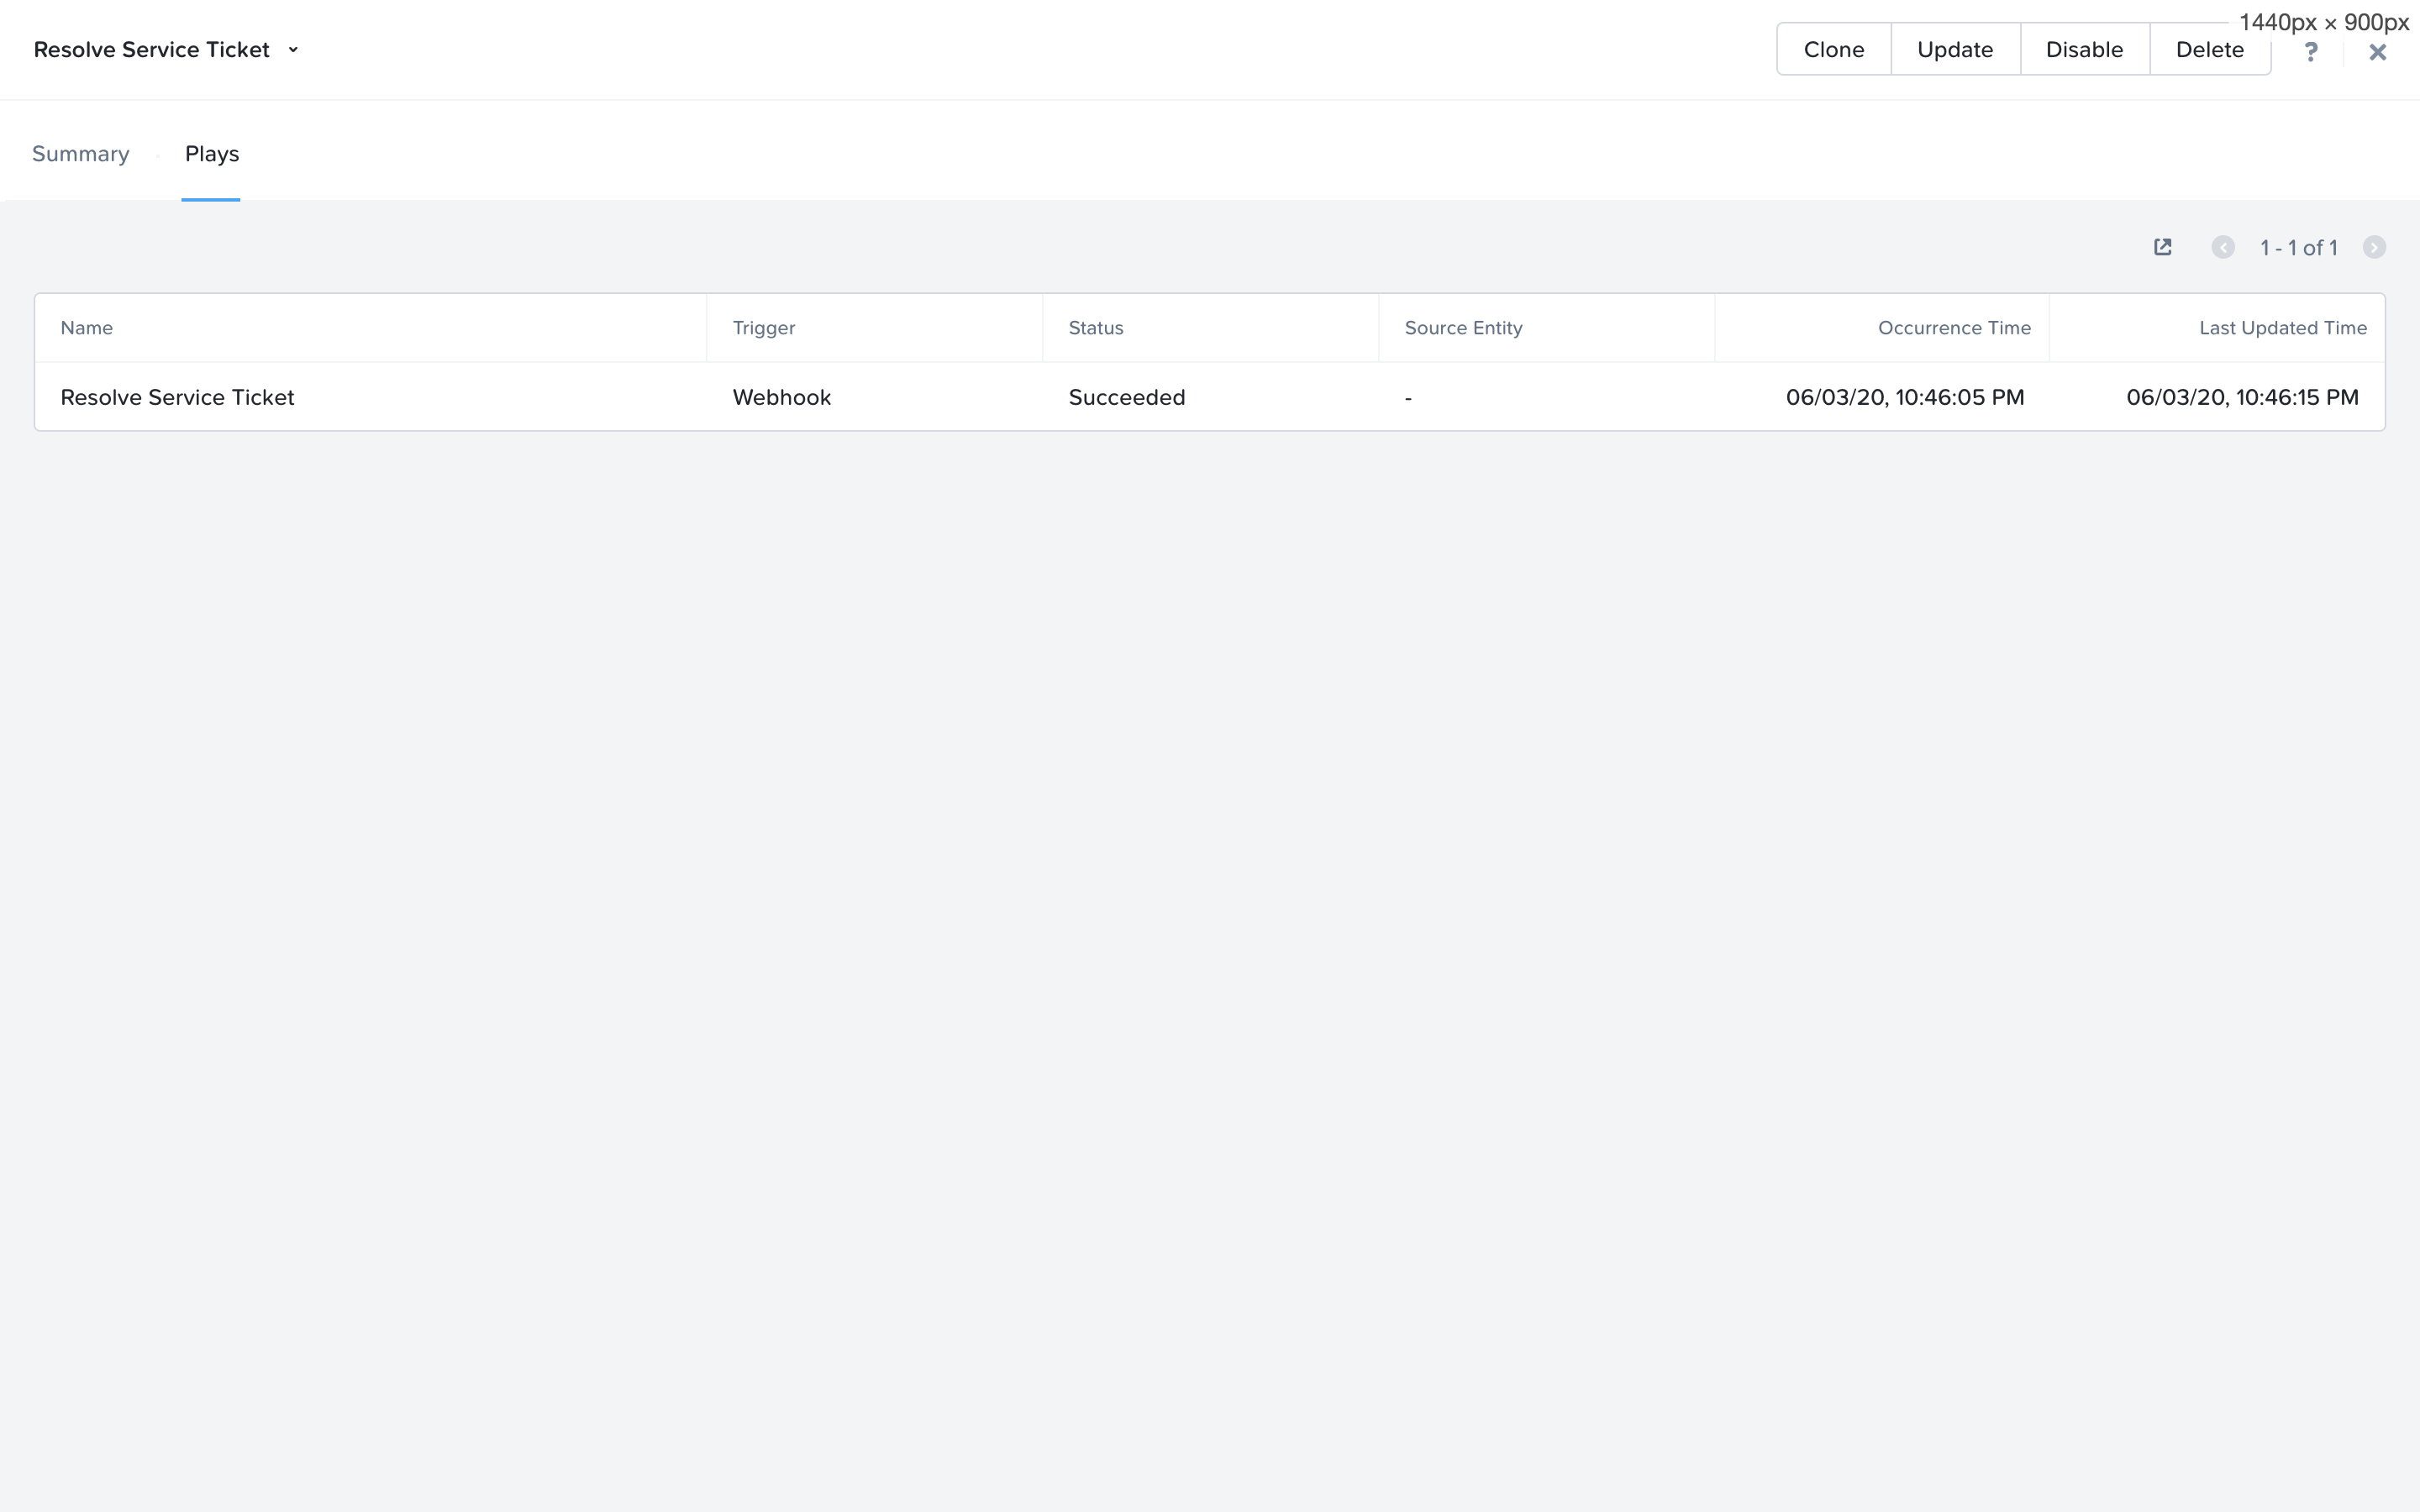
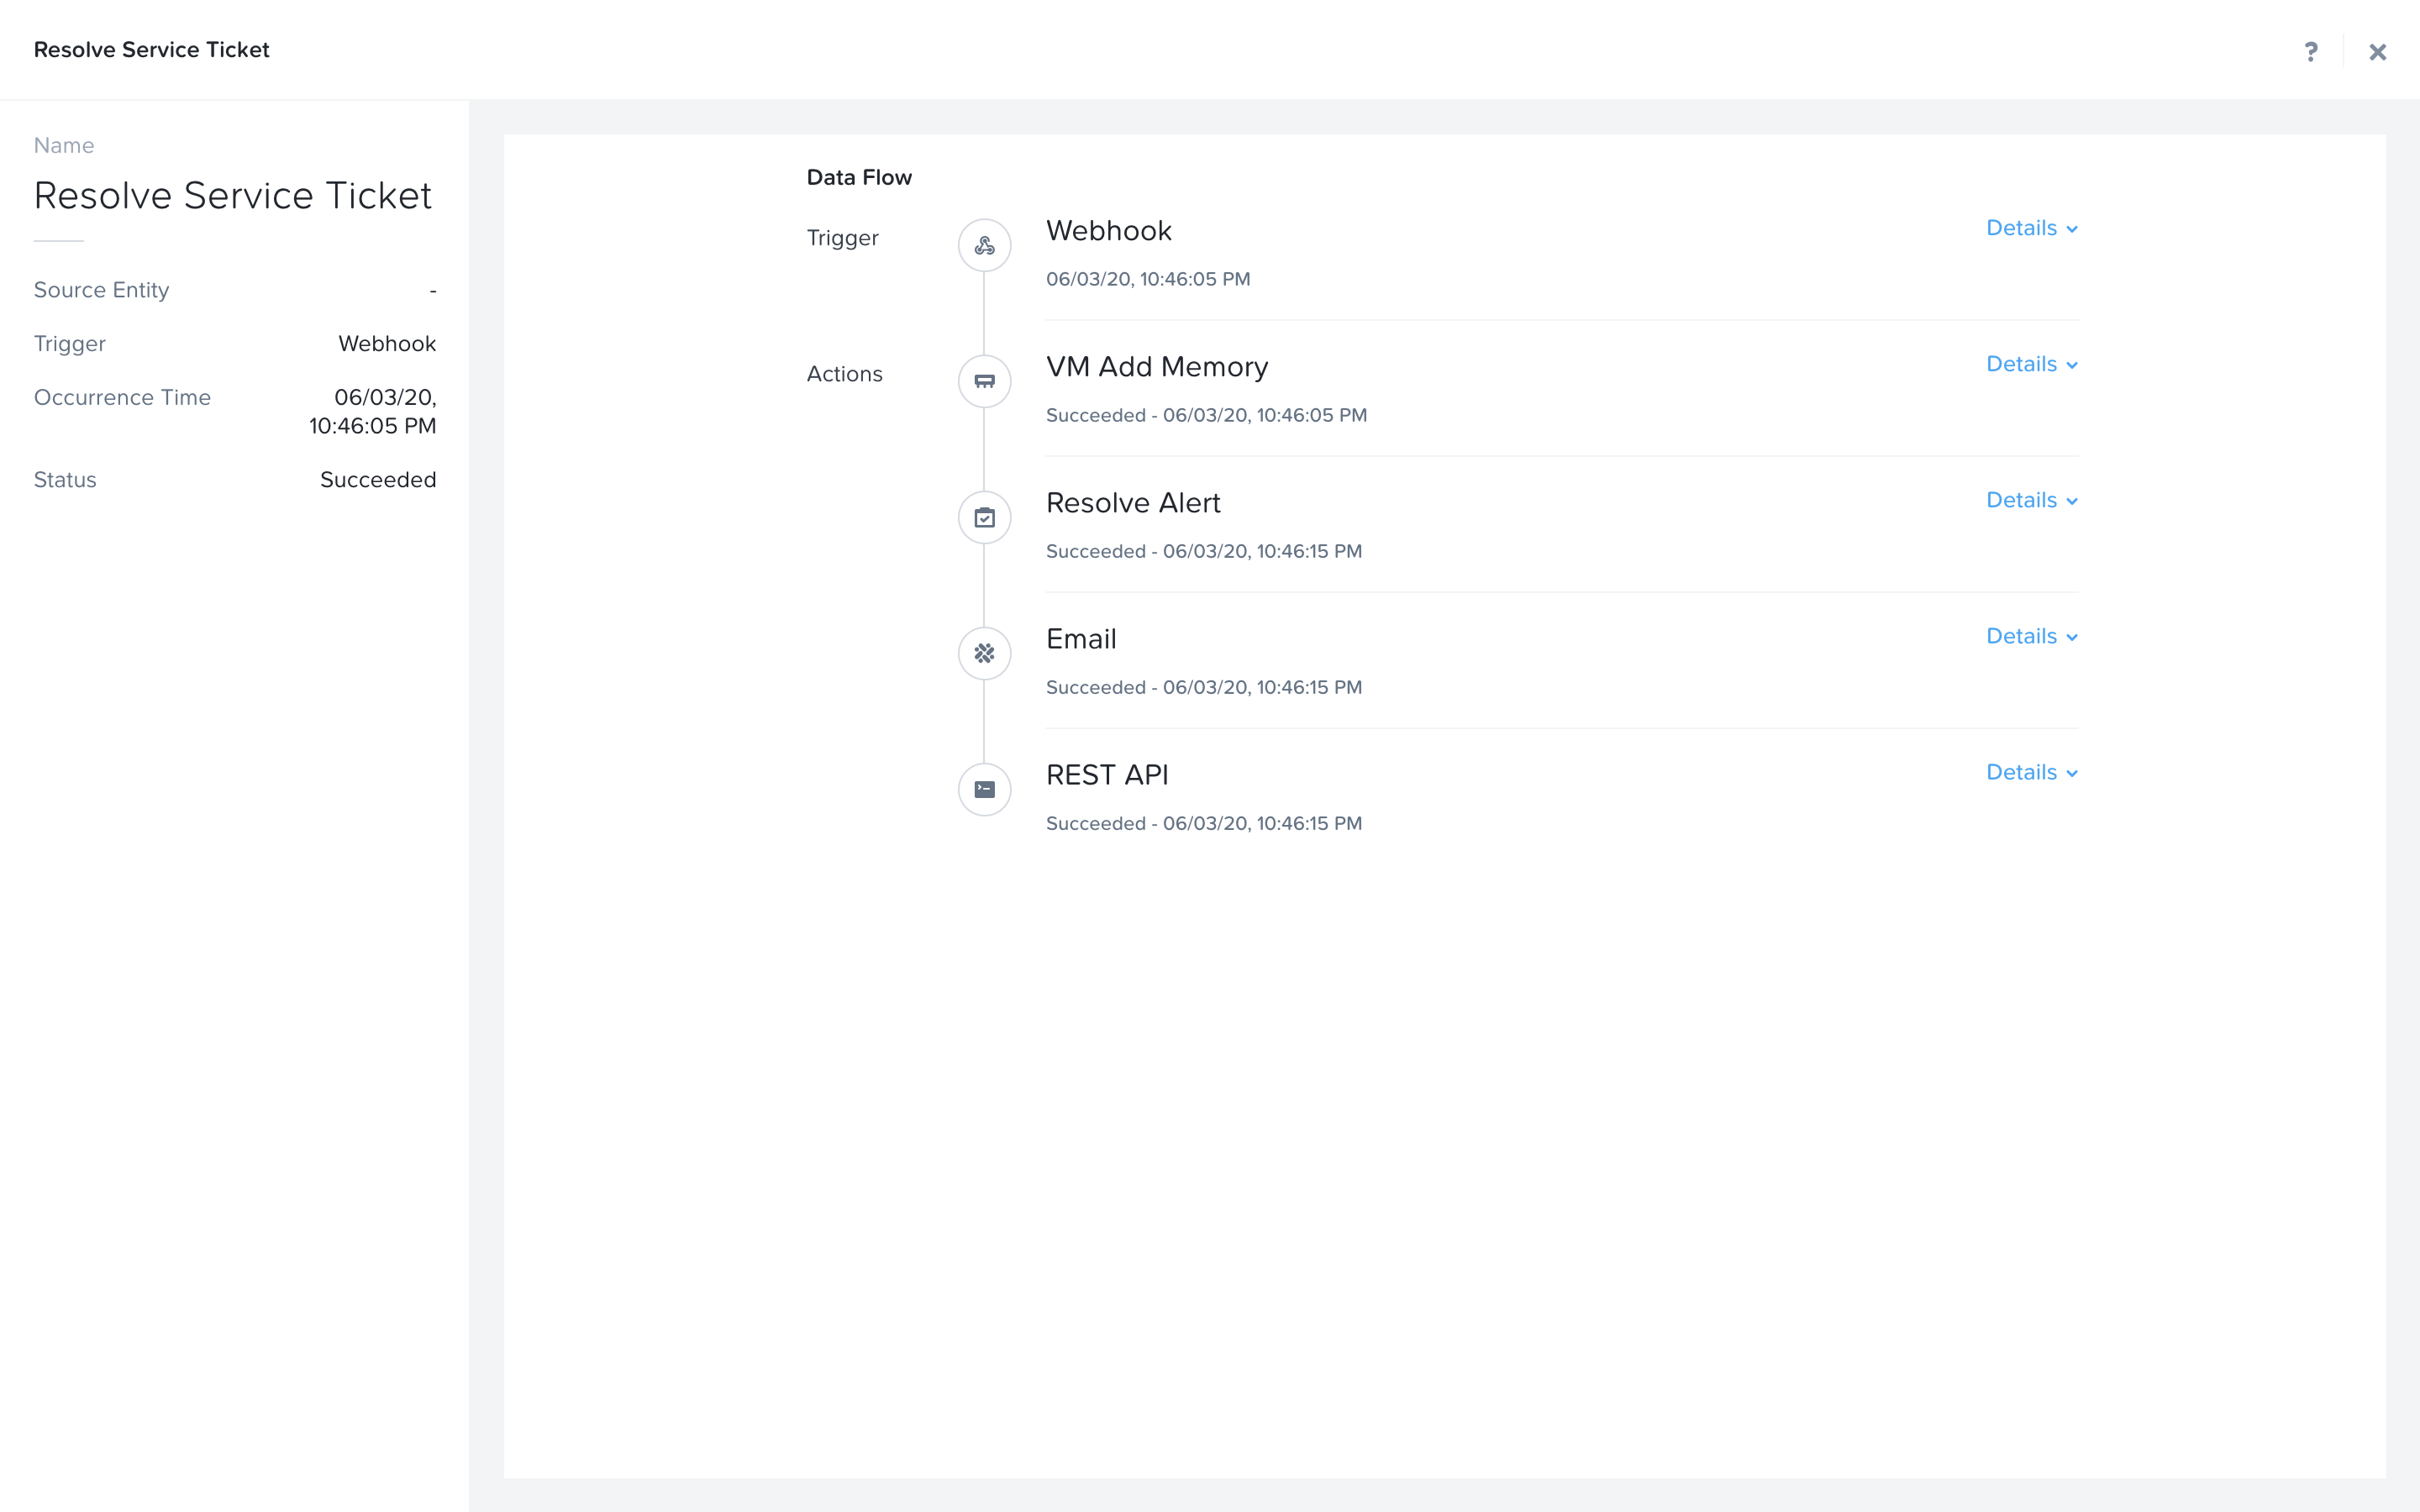
Switch back to the previous tab with the Prism Central console open. Open up the details for the `Initials` - Resolve Service Ticket Playbook and click the Plays tab towards the top of the view to take a look at the Plays that executed for this playbook. Click on the title of the Play in the table to take a closer look.
The sections in this view can be expanded to show more details for each item. If there were any errors, they would also be surfaced in this view.
You can navigate back to your VM and verify that the Memory was indeed increased by 1 GiB.
You should also get an email telling you that the playbook ran.
Takeaways
Prism Pro is our solution to make IT OPS smarter and automated. It covers the IT OPS process ranging from intelligent detection to automated remediation.
X-FIT is our machine learning engine to support smart IT OPS, including anomaly detection, and inefficiency detection.
X-Play, the IFTTT for the enterprise, is our engine to enable the automation of daily operations tasks.
X-Play enables admins to confidently automate their daily tasks within minutes.
X-Play is extensive that can use customer’s existing APIs and scripts as part of its Playbooks, and can integrate nicely with customers existing ticketing workflows.